Guide to this Report
The following subsections describe the format of the Climate Science Special Report and the overall structure and features of the chapters.
Executive Summary
The Executive Summary describes the major findings from the Climate Science Special Report. It summarizes the overall findings and includes some key figures and additional bullet points covering overarching and especially noteworthy conclusions. The Executive Summary and the majority of the Key Findings are written to be accessible to a wide range of audiences.
Chapters
Key Findings and Traceable Accounts
Each topical chapter includes Key Findings, which are based on the authors’ expert judgment of the synthesis of the assessed literature. Each Key Finding includes a confidence statement and, as appropriate, framing of key scientific uncertainties, so as to better support assessment of climate-related risks. (See “Documenting Uncertainty” below).
Each Key Finding is also accompanied by a Traceable Account that documents the supporting evidence, process, and rationale the authors used in reaching these conclusions and provides additional information on sources of uncertainty through confidence and likelihood statements. The Traceable Accounts can be found at the end of each chapter.
Regional Analyses
Throughout the report, the regional analyses of climate changes for the United States are structured on 10 different regions as shown in Figure 1. There are differences from the regions used in the Third National Climate Assessment2 : 1) the Great Plains are split into the Northern Great Plains and Southern Great Plains; and 2) The U.S. islands in the Caribbean are analyzed as a separate region apart from the Southeast.
Chapter Text
Each chapter assesses the state of the science for a particular aspect of the changing climate. The first chapter gives a summary of the global changes occurring in the Earth’s climate system. This is followed in Chapter 2 by a summary of the scientific basis for climate change. Chapter 3 gives an overview of the processes used in the detection and attribution of climate change and associated studies using those techniques. Chapter 4 then discusses the scenarios for greenhouse gases and particles and the modeling tools used to study future projections. Chapters 5 through 9 primarily focus on physical changes in climate occurring in the United States, including those projected to occur in the future. Chapter 10 provides a focus on land use change and associated feedbacks on climate. Chapter 11 addresses changes in Alaska in the Arctic, and how the latter affects the United States. Chapters 12 and 13 discuss key issues connected with sea level rise and ocean changes, including ocean acidification, and their potential effects on the United States. Finally, Chapters 14 and 15 discuss some important perspectives on how mitigation activities could affect future changes in climate and provide perspectives on what surprises could be in store for the changing climate beyond the analyses already covered in the rest of the assessment.
Throughout the report, results are presented in United States customary units (e.g., degrees Fahrenheit) as well as in the International System of Units (e.g., degrees Celsius).
Reference Time Periods for Graphics
There are many different types of graphics in the Climate Science Special Report. Some of the graphs in this report illustrate historical changes and future trends in climate compared to some reference period, with the choice of this period determined by the purpose of the graph and the availability of data. The scientific community does not have a standard set of reference time periods for assessing the science, and these tend to be chosen differently for different reports and assessments. Some graphics are pulled from other studies using different time periods.
Where graphs were generated for this report (those not based largely on prior publications), they are mostly based on one of two reference periods. The 1901–1960 reference period is particularly used for graphs that illustrate past changes in climate conditions, whether in observations or in model simulations. This 60-year time period was also used for analyses in the Third National Climate Assessment (NCA32 ). The beginning date was chosen because earlier historical observations are generally considered to be less reliable. While a 30-year base period is often used for climate analyses, the choice of 1960 as the ending date of this period was based on past changes in human influences on the climate system. Human-induced forcing exhibited a slow rise during the early part of the last century but then accelerated after 1960. Thus, these graphs highlight observed changes in climate during the period of rapid increase in human-caused forcing and also reveal how well climate models simulate these observed changes.
Thus, a number of the graphs in the report are able to highlight the recent, more rapid changes relative to the early part of the century (the reference period) and also reveal how well the climate models simulate observed changes. In this report, this time period is used as the base period in most maps of observed trends and all time-varying, area-weighted averages that show both observed and projected quantities. For the observed trends, 1986–2015 is generally chosen as the most recent 30-year period (2016 data was not fully available until late in our development of the assessment).
The other commonly used reference period in this report is 1976–2005. The choice of a 30-year period is chosen to account for natural variations and to have a reasonable sampling in order to estimate likelihoods of trends in extremes. This period is consistent with the World Meteorological Organization’s recommendation for climate statistics. This period is used for graphs that illustrate projected changes simulated by climate models. The purpose of these graphs is to show projected changes compared to a period that allows stakeholders and decision makers to base fundamental planning and decisions on average and extreme climate conditions in a non-stationary climate; thus, a recent available 30-year period was chosen.3 The year 2005 was chosen as an end date because the historical period simulated by the models used in this assessment ends in that year.
For future projections, 30-year periods are again used for consistency. Projections are centered around 2030, 2050, and 2085 with an interval of plus and minus 15 years (for example, results for 2030 cover the period 2015–2045); Most model runs used here only project out to 2100 for future scenarios, but where possible, results beyond 2100 are shown. Note that these time periods are different than those used in some of the graphics in NCA3. There are also exceptions for graphics that are based on existing publications.
For global results that may be dependent on findings from other assessments (such as those produced by the Intergovernmental Panel on Climate Change, or IPCC), and for other graphics that depend on specific published work, the use of other time periods was also allowed, but an attempt was made to keep them as similar to the selected periods as possible. For example, in the discussion of radiative forcing, the report uses the standard analyses from IPCC for the industrial era (1750 to 2011) (following IPCC 2013a1 ). And, of course, the paleoclimatic discussion of past climates goes back much further in time.
Model Results: Past Trends and Projected Futures
The NCA3 included global modeling results from both the CMIP3 (Coupled Model Intercomparison Project, 3rd phase) models used in the 2007 international assessment4 and the CMIP5 (Coupled Model Intercomparison Project, Phase 5) models used in the more recent international assessment.1 Here, the primary resource for this assessment is the more recent global model results and associated downscaled products from CMIP5. The CMIP5 models and the associated downscaled products are discussed in Chapter 4: Projections.
Treatment of Uncertainties: Likelihoods, Confidence, and Risk Framing
Throughout this report’s assessment of the scientific understanding of climate change, the authors have assessed to the fullest extent possible the state-of-the-art understanding of the science resulting from the information in the scientific literature to arrive at a series of findings referred to as Key Findings. The approach used to represent the extent of understanding represented in the Key Findings is done through two metrics:
Confidence in the validity of a finding based on the type, amount, quality, strength, and consistency of evidence (such as mechanistic understanding, theory, data, models, and expert judgment); the skill, range, and consistency of model projections; and the degree of agreement within the body of literature.
Likelihood, or probability of an effect or impact occurring, is based on measures of uncertainty expressed probabilistically (based on the degree of understanding or knowledge, e.g., resulting from evaluating statistical analyses of observations or model results or on expert judgment).
The terminology used in the report associated with these metrics is shown in Figure 2. This language is based on that used in NCA3,2 the IPCC’s Fifth Assessment Report,1 and most recently the USGCRP Climate and Health assessment.5 Wherever used, the confidence and likelihood statements are italicized.
Assessments of confidence in the Key Findings are based on the expert judgment of the author team. Authors provide supporting evidence for each of the chapter’s Key Findings in the Traceable Accounts. Confidence is expressed qualitatively and ranges from low confidence (inconclusive evidence or disagreement among experts) to very high confidence (strong evidence and high consensus) (see Figure 2). Confidence should not be interpreted probabilistically, as it is distinct from statistical likelihood. See chapter 1 in IPCC1 for further discussion of this terminology.
In this report, likelihood is the chance of occurrence of an effect or impact based on measures of uncertainty expressed probabilistically (based on statistical analysis of observations or model results or on expert judgment). The authors used expert judgment based on the synthesis of the literature assessed to arrive at an estimation of the likelihood that a particular observed effect was related to human contributions to climate change or that a particular impact will occur within the range of possible outcomes. Model uncertainty is an important contributor to uncertainty in climate projections, and includes, but is not restricted to, the uncertainties introduced by errors in the model’s representation of the physical and bio-geochemical processes affecting the climate system as well as in the model’s response to external forcing.1
Where it is considered justified to report the likelihood of particular impacts within the range of possible outcomes, this report takes a plain-language approach to expressing the expert judgment of the chapter team, based on the best available evidence. For example, an outcome termed “likely” has at least a 66% chance of occurring (a likelihood greater than about 2 of 3 chances); an outcome termed “very likely,” at least a 90% chance (more than 9 out of 10 chances). See Figure 2 for a complete list of the likelihood terminology used in this report.
Traceable Accounts for each Key Finding 1) document the process and rationale the authors used in reaching the conclusions in their Key Finding, 2) provide additional information to readers about the quality of the information used, 3) allow traceability to resources and data, and 4) describe the level of likelihood and confidence in the Key Finding. Thus, the Traceable Accounts represent a synthesis of the chapter author team’s judgment of the validity of findings, as determined through evaluation of evidence and agreement in the scientific literature. The Traceable Accounts also identify areas where data are limited or emerging. Each Traceable Account includes 1) a description of the evidence base, 2) major uncertainties, and 3) an assessment of confidence based on evidence.
All Key Findings include a description of confidence. Where it is considered scientifically justified to report the likelihood of particular impacts within the range of possible outcomes, Key Findings also include a likelihood designation.
Confidence and likelihood levels are based on the expert judgment of the author team. They determined the appropriate level of confidence or likelihood by assessing the available literature, determining the quality and quantity of available evidence, and evaluating the level of agreement across different studies. Often, the underlying studies provided their own estimates of uncertainty and confidence intervals. When available, these confidence intervals were assessed by the authors in making their own expert judgments. For specific descriptions of the process by which the author team came to agreement on the Key Findings and the assessment of confidence and likelihood, see the Traceable Accounts in each chapter.
In addition to the use of systematic language to convey confidence and likelihood information, this report attempts to highlight aspects of the science that are most relevant for supporting other parts of the Fourth National Climate Assessment and its analyses of key societal risks posed by climate change. This includes attention to trends and changes in the tails of the probability distribution of future climate change and its proximate impacts (for example, on sea level or temperature and precipitation extremes) and on defining plausible bounds for the magnitude of future changes, since many key risks are disproportionately determined by plausible low-probability, high-consequence outcomes. Therefore, in addition to presenting the expert judgment on the “most likely” range of projected future climate outcomes, where appropriate, this report also provides information on the outcomes lying outside this range, which nevertheless cannot be ruled out and may therefore be relevant for assessing overall risk. In some cases, this involves an evaluation of the full range of information contained in the ensemble of climate models used for this report, and in other cases this involves the consideration of additional lines of scientific evidence beyond the models.
Complementing this use of risk-focused language and presentation around specific scientific findings in the report, Chapter 15: Potential Surprises provides an overview of potential low probability/high consequence “surprises” resulting from climate change. This includes its analyses of thresholds, also called tipping points, in the climate system and the compounding effects of multiple, interacting climate change impacts whose consequences may be much greater than the sum of the individual impacts. Chapter 15 also highlights critical knowledge gaps that determine the degree to which such high-risk tails and bounding scenarios can be precisely defined, including missing processes and feedbacks.
Figure 1
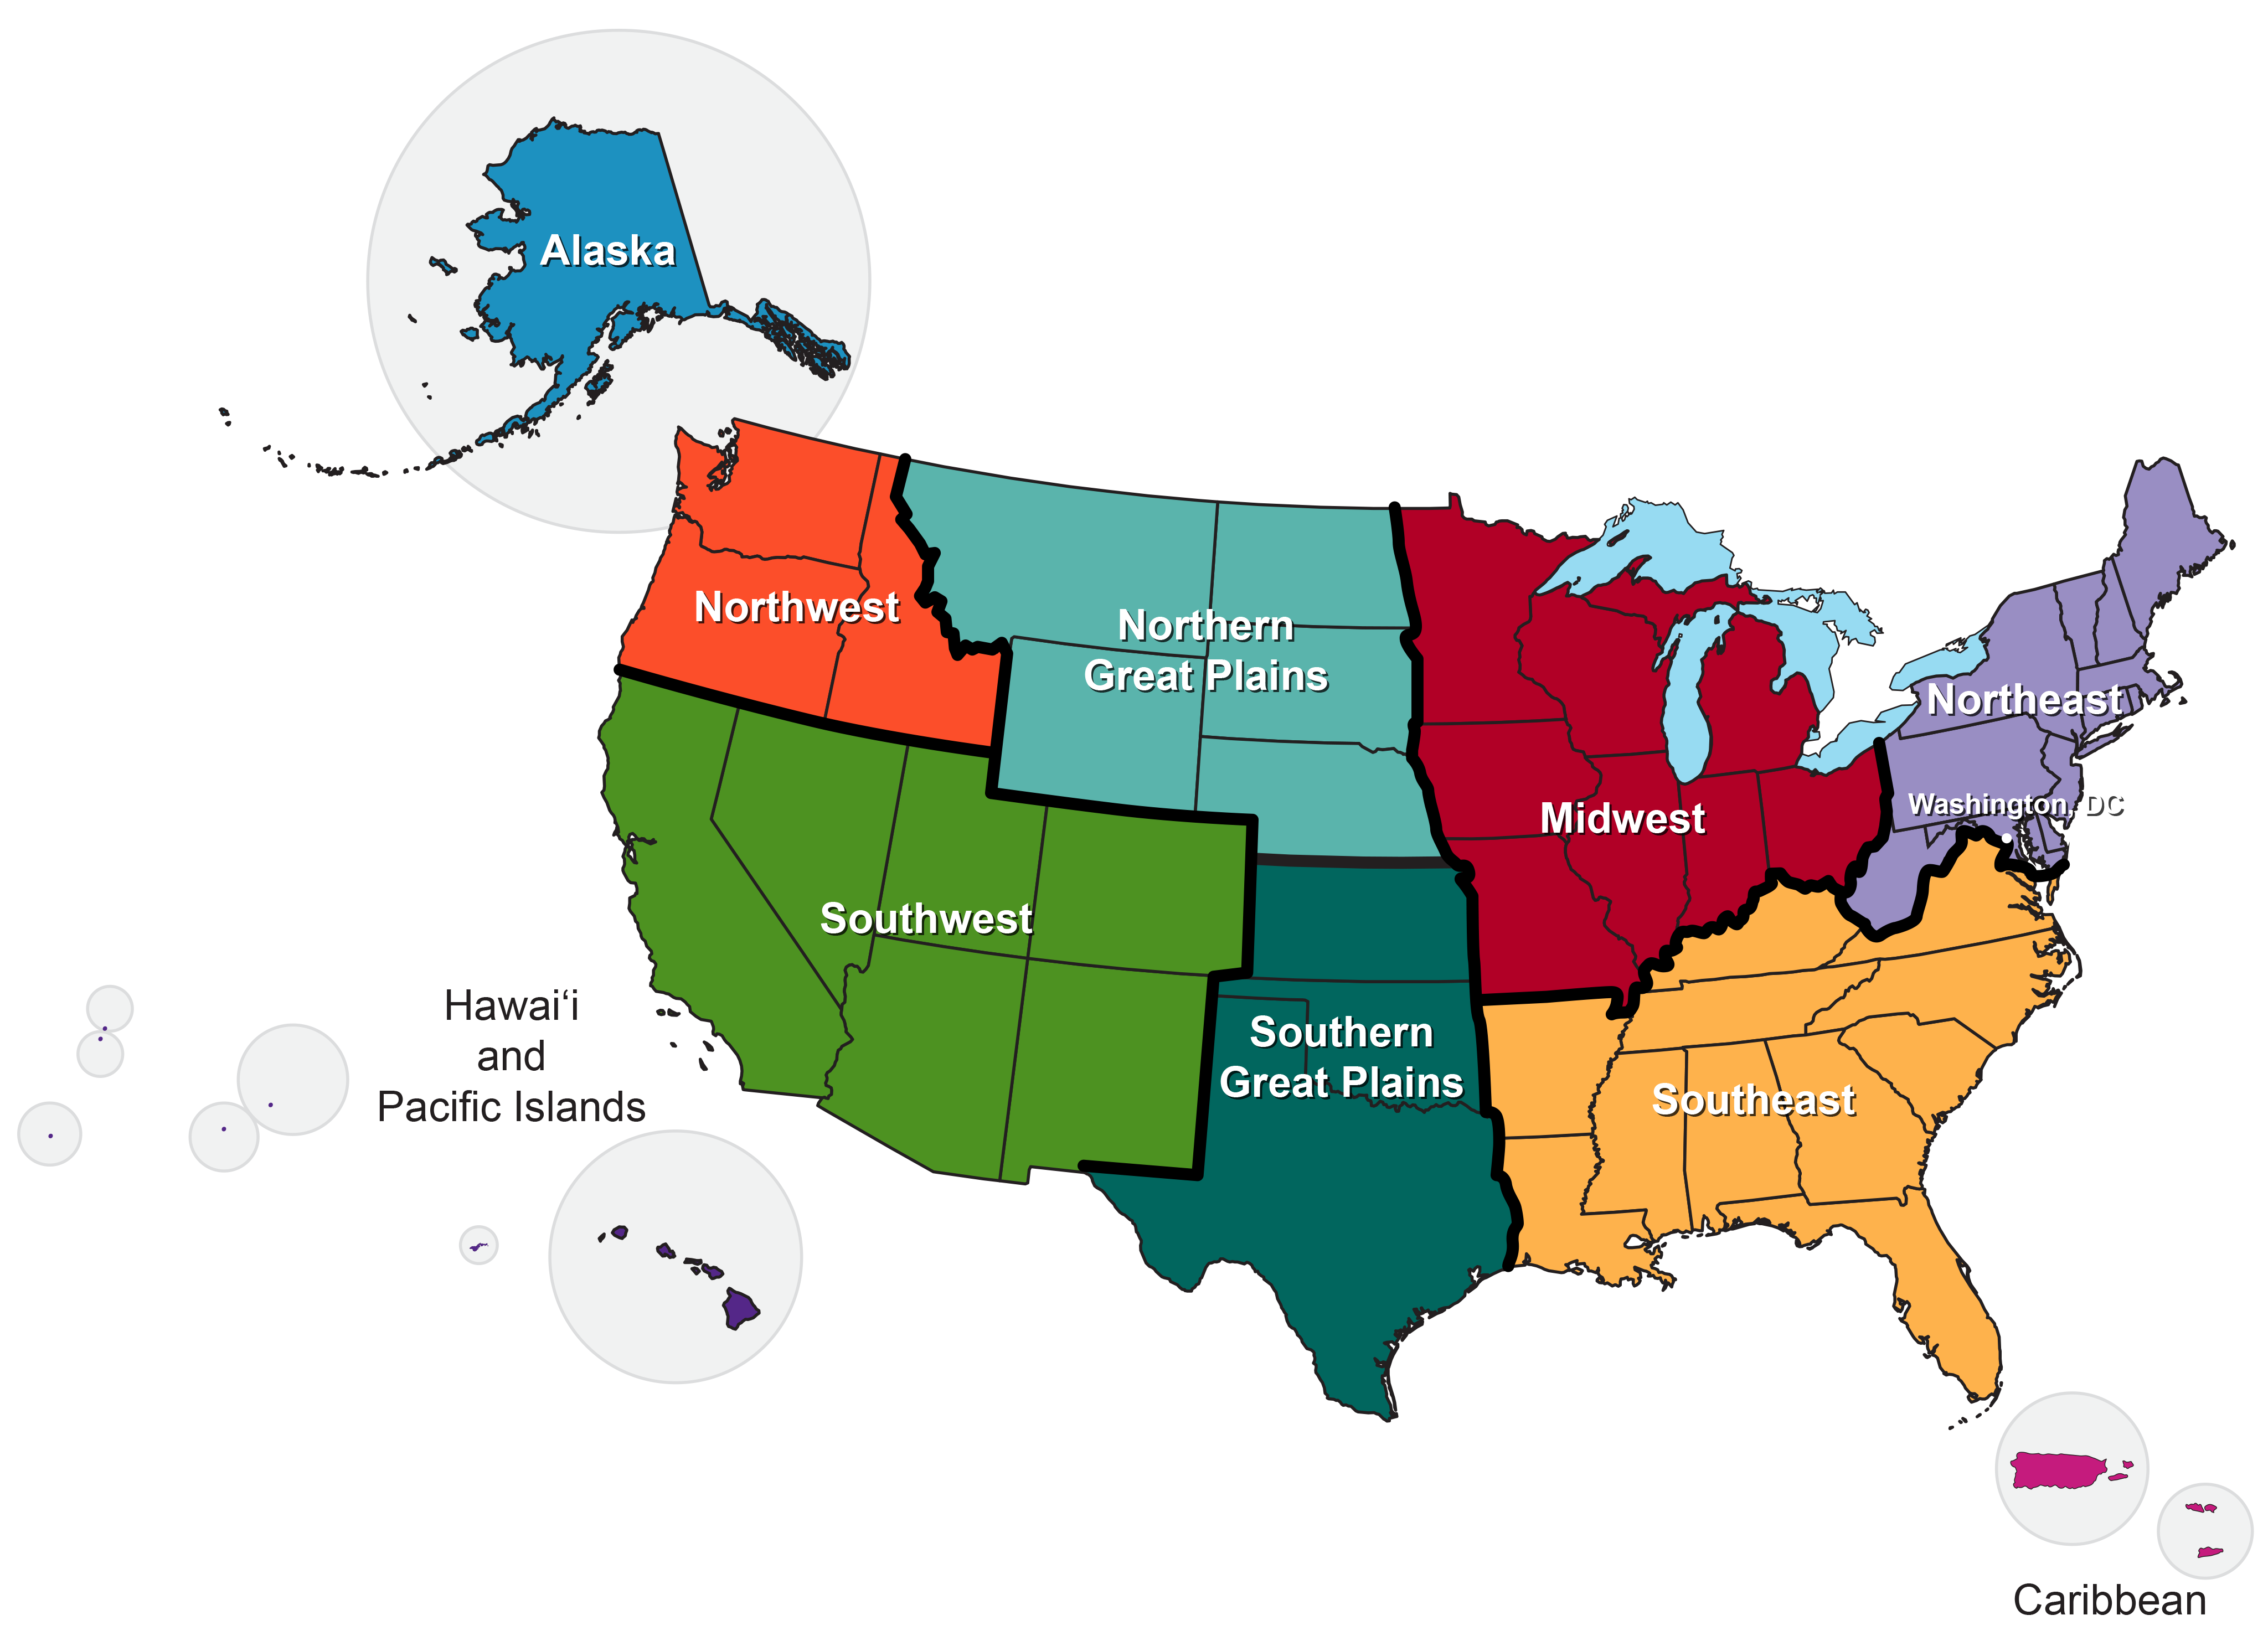
Map of the ten regions of the United States used throughout the Climate Science Special Report. Regions are similar to that used in the Third National Climate Assessment except that 1) the Great Plains are split into the Northern Great Plains and Southern Great Plains, and 2) the Caribbean islands have been split from the Southeast region. (Figure source: adapted from Melillo et al. 20142 ).
Likelihood
| Exceptionally Unlikely | Extremely Unlikely | Very Unikely | Unlikely | About as Likely as Not | Likely | Very Likely | Extremely Likely | Virtually Certain |
|---|---|---|---|---|---|---|---|---|
| 0%–1% | 0%–5% | 0%–10% | 0%–33% | 33%–66% | 66%–100% | 90%–100% | 95%–100% | 99%–100% |
Confidence Level
| Low | Medium | High | Very High |
|---|---|---|---|
| Inconclusive evidence (limited sources, extrapolations, inconsistent findings, poor documentation and/or methods not tested, etc.), disagreement or lack of opinions among experts | Suggestive evidence (a few sources, limited consistency, models incomplete, methods emerging, etc.), competing schools of thought | Moderate evidence (several sources, some consistency, methods vary and/or documentation limited, etc.), medium consensus | Strong evidence (established theory, multiple sources, consistent results, well documented and accepted methods, etc.), high consensus |