6.0: Introduction
Temperature is among the most important climatic elements used in decision-making. For example, builders and insurers use temperature data for planning and risk management while energy companies and regulators use temperature data to predict demand and set utility rates. Temperature is also a key indicator of climate change: recent increases are apparent over the land, ocean, and troposphere, and substantial changes are expected for this century. This chapter summarizes the major observed and projected changes in near-surface air temperature over the United States, emphasizing new data sets and model projections since the Third National Climate Assessment (NCA3). Changes are depicted using a spectrum of observations, including surface weather stations, moored ocean buoys, polar-orbiting satellites, and temperature-sensitive proxies. Projections are based on global models and downscaled products from CMIP5 (Coupled Model Intercomparison Project Phase 5) using a suite of Representative Concentration Pathways (RCPs; see Ch. 4: Projections for more on RCPs and future scenarios).
6.1: Historical Changes
6.1.1 Average Temperatures
Changes in average temperature are described using a suite of observational datasets. As in NCA3, changes in land temperature are assessed using the nClimGrid dataset.1 ,2 Along U.S. coastlines, changes in sea surface temperatures are quantified using a new reconstruction3 that forms the ocean component of the NOAA Global Temperature dataset.4 Changes in middle tropospheric temperature are examined using updated versions of multiple satellite datasets.5 ,6 ,7
The annual average temperature of the contiguous United States has risen since the start of the 20th century. In general, temperature increased until about 1940, decreased until about 1970, and increased rapidly through 2016. Because the increase was not constant over time, multiple methods were evaluated in this report (as in NCA3) to quantify the trend. All methods yielded rates of warming that were significant at the 95% level. The lowest estimate of 1.2°F (0.7°C) was obtained by computing the difference between the average for 1986–2016 (i.e., present-day) and the average for 1901–1960 (i.e., the first half of the last century). The highest estimate of 1.8°F (1.0°C) was obtained by fitting a linear (least-squares) regression line through the period 1895–2016. Thus, the temperature increase cited in this assessment is 1.2°–1.8°F (0.7°–1.0°C).
This increase is about 0.1°F (0.06°C) less than presented in NCA3, and it results from the use of slightly different periods in each report. In particular, the decline in the lower bound stems from the use of different time periods to represent present-day climate (NCA3 used 1991–2012, which was slightly warmer than the 1986–2016 period used here). The decline in the upper bound stems mainly from temperature differences late in the record (e.g., the last year of data available for NCA3 was 2012, which was the warmest year on record for the contiguous United States).
Each NCA region experienced a net warming through 2016 (Table 6.1). The largest changes were in the western United States, where average temperature increased by more than 1.5°F (0.8°C) in Alaska, the Northwest, the Southwest, and also in the Northern Great Plains. As noted in NCA3, the Southeast had the least warming, driven by a combination of natural variations and human influences.8 In most regions, average minimum temperature increased at a slightly higher rate than average maximum temperature, with the Midwest having the largest discrepancy, and the Southwest and Northwest having the smallest. This differential rate of warming resulted in a continuing decrease in the diurnal temperature range that is consistent with other parts of the globe.9 Annual average sea surface temperature also increased along all regional coastlines (see Figure 1.3), though changes were generally smaller than over land owing to the higher heat capacity of water. Increases were largest in Alaska (greater than 1.0°F [0.6°C]) while increases were smallest (less than 0.5°F [0.3°C]) in coastal areas of the Southeast.
| NCA Region | Change in Annual Average Temperature | Change in Annual Average Maximum Temperature | Change in Annual Average Minimum Temperature |
|---|---|---|---|
| Contiguous U.S. | 1.23°F | 1.06°F | 1.41°F |
| Northeast | 1.43°F | 1.16°F | 1.70°F |
| Southeast | 0.46°F | 0.16°F | 0.76°F |
| Midwest | 1.26°F | 0.77°F | 1.75°F |
| Great Plains North | 1.69°F | 1.66°F | 1.72°F |
| Great Plains South | 0.76°F | 0.56°F | 0.96°F |
| Southwest | 1.61°F | 1.61°F | 1.61°F |
| Northwest | 1.54°F | 1.52°F | 1.56°F |
| Alaska | 1.67°F | 1.43°F | 1.91°F |
| Hawaii | 1.26°F | 1.01°F | 1.49°F |
| Caribbean | 1.35°F | 1.08°F | 1.60°F |
More than 95% of the land surface of the contiguous United States had an increase in annual average temperature (Figure 6.1). In contrast, only small (and somewhat dispersed) parts of the Southeast and Southern Great Plains experienced cooling. From a seasonal perspective, warming was greatest and most widespread in winter, with increases of over 1.5°F (0.8°C) in most areas. In summer, warming was less extensive (mainly along the East Coast and in the western third of the Nation), while cooling was evident in parts of the Southeast, Midwest, and Great Plains.
Figure 6.1
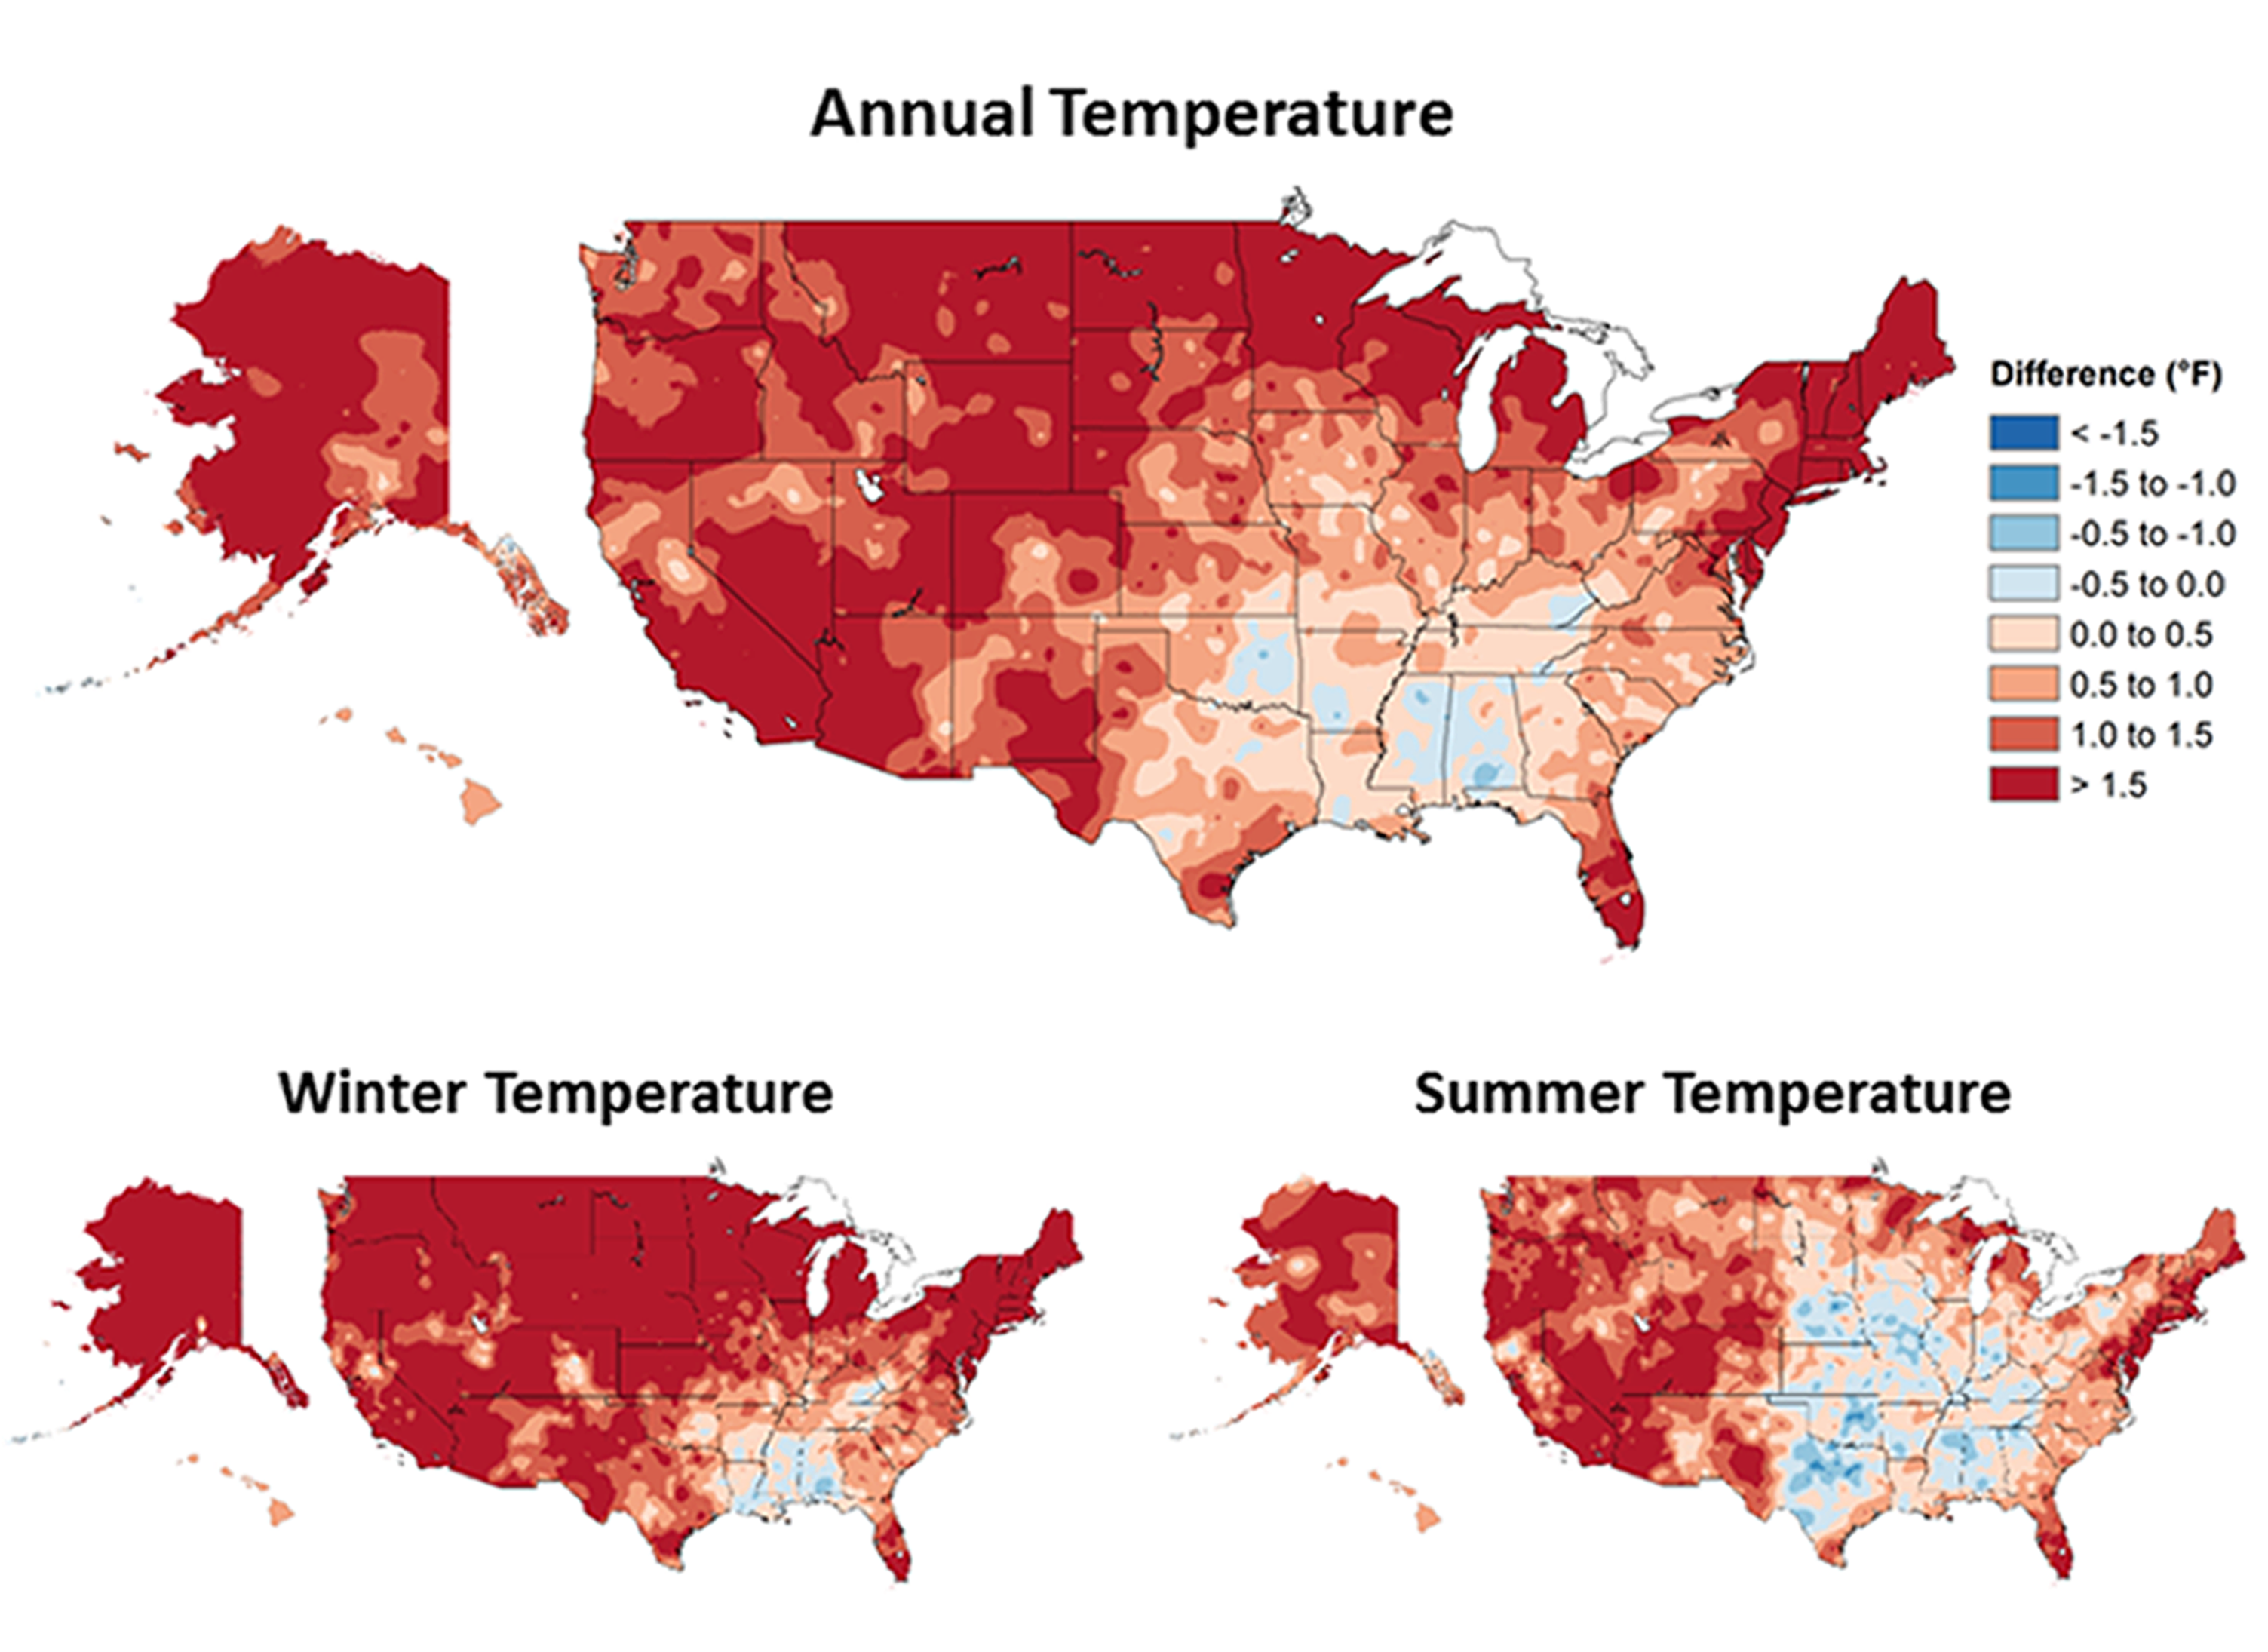
Observed changes in annual, winter, and summer temperature (°F). Changes are the difference between the average for present-day (1986–2016) and the average for the first half of the last century (1901–1960 for the contiguous United States, 1925–1960 for Alaska and Hawai‘i). Estimates are derived from the nClimDiv dataset. 1 ,2 (Figure source: NOAA/NCEI).
There has been a rapid increase in the average temperature of the contiguous United States over the past several decades. There is general consistency on this point between the surface thermometer record from NOAA1 and the middle tropospheric satellite records from Remote Sensing Systems (RSS),5 NOAA’s Center for Satellite Applications and Research (STAR),7 and the University of Alabama in Huntsville (UAH).6 In particular, for the period 1979–2016, the rate of warming in the surface record was 0.512°F (0.284°C) per decade, versus trends of 0.455°F (0.253°C), 0.421°F (0.234°C), and 0.289°F (0.160 °C) per decade for RSS version 4, STAR version 3, and UAH version 6, respectively (after accounting for stratospheric influences). All trends are statistically significant at the 95% level. For the contiguous United States, the year 2016 was the second-warmest on record at the surface and in the middle troposphere (2012 was the warmest year at the surface, and 2015 was the warmest in the middle troposphere). Generally speaking, surface and satellite records do not have identical trends because they do not represent the same physical quantity; surface measurements are made using thermometers in shelters about 1.5 meters above the ground whereas satellite measurements are mass-weighted averages of microwave emissions from deep atmospheric layers. The UAH record likely has a lower trend because it differs from the other satellite products in the treatment of target temperatures from the NOAA-9 satellite as well as in the correction for diurnal drift.10
Recent paleo-temperature evidence confirms the unusual character of wide-scale warming during the past few decades as determined from the instrumental record. The most important new paleoclimate study since NCA3 showed that for each of the seven continental regions, the reconstructed area-weighted average temperature for 1971–2000 was higher than for any other time in nearly 1,400 years,11 although with significant uncertainty around the central estimate that leads to this conclusion. Recent (up to 2006) 30-year smoothed temperatures across temperate North America (including most of the continental United States) are similarly reconstructed as the warmest over the past 1,500 years12 (Figure 6.2). Unlike the PAGES 2k seven-continent result mentioned above, this conclusion for North America is robust in relation to the estimated uncertainty range. Reconstruction data since 1500 for western temperate North America show the same conclusion at the annual time scale for 1986–2005. This time period and the running 20-year periods thereafter are warmer than all possible continuous 20-year sequences in a 1,000-member statistical reconstruction ensemble.13
6.1.2 Temperature Extremes
Figure 6.2
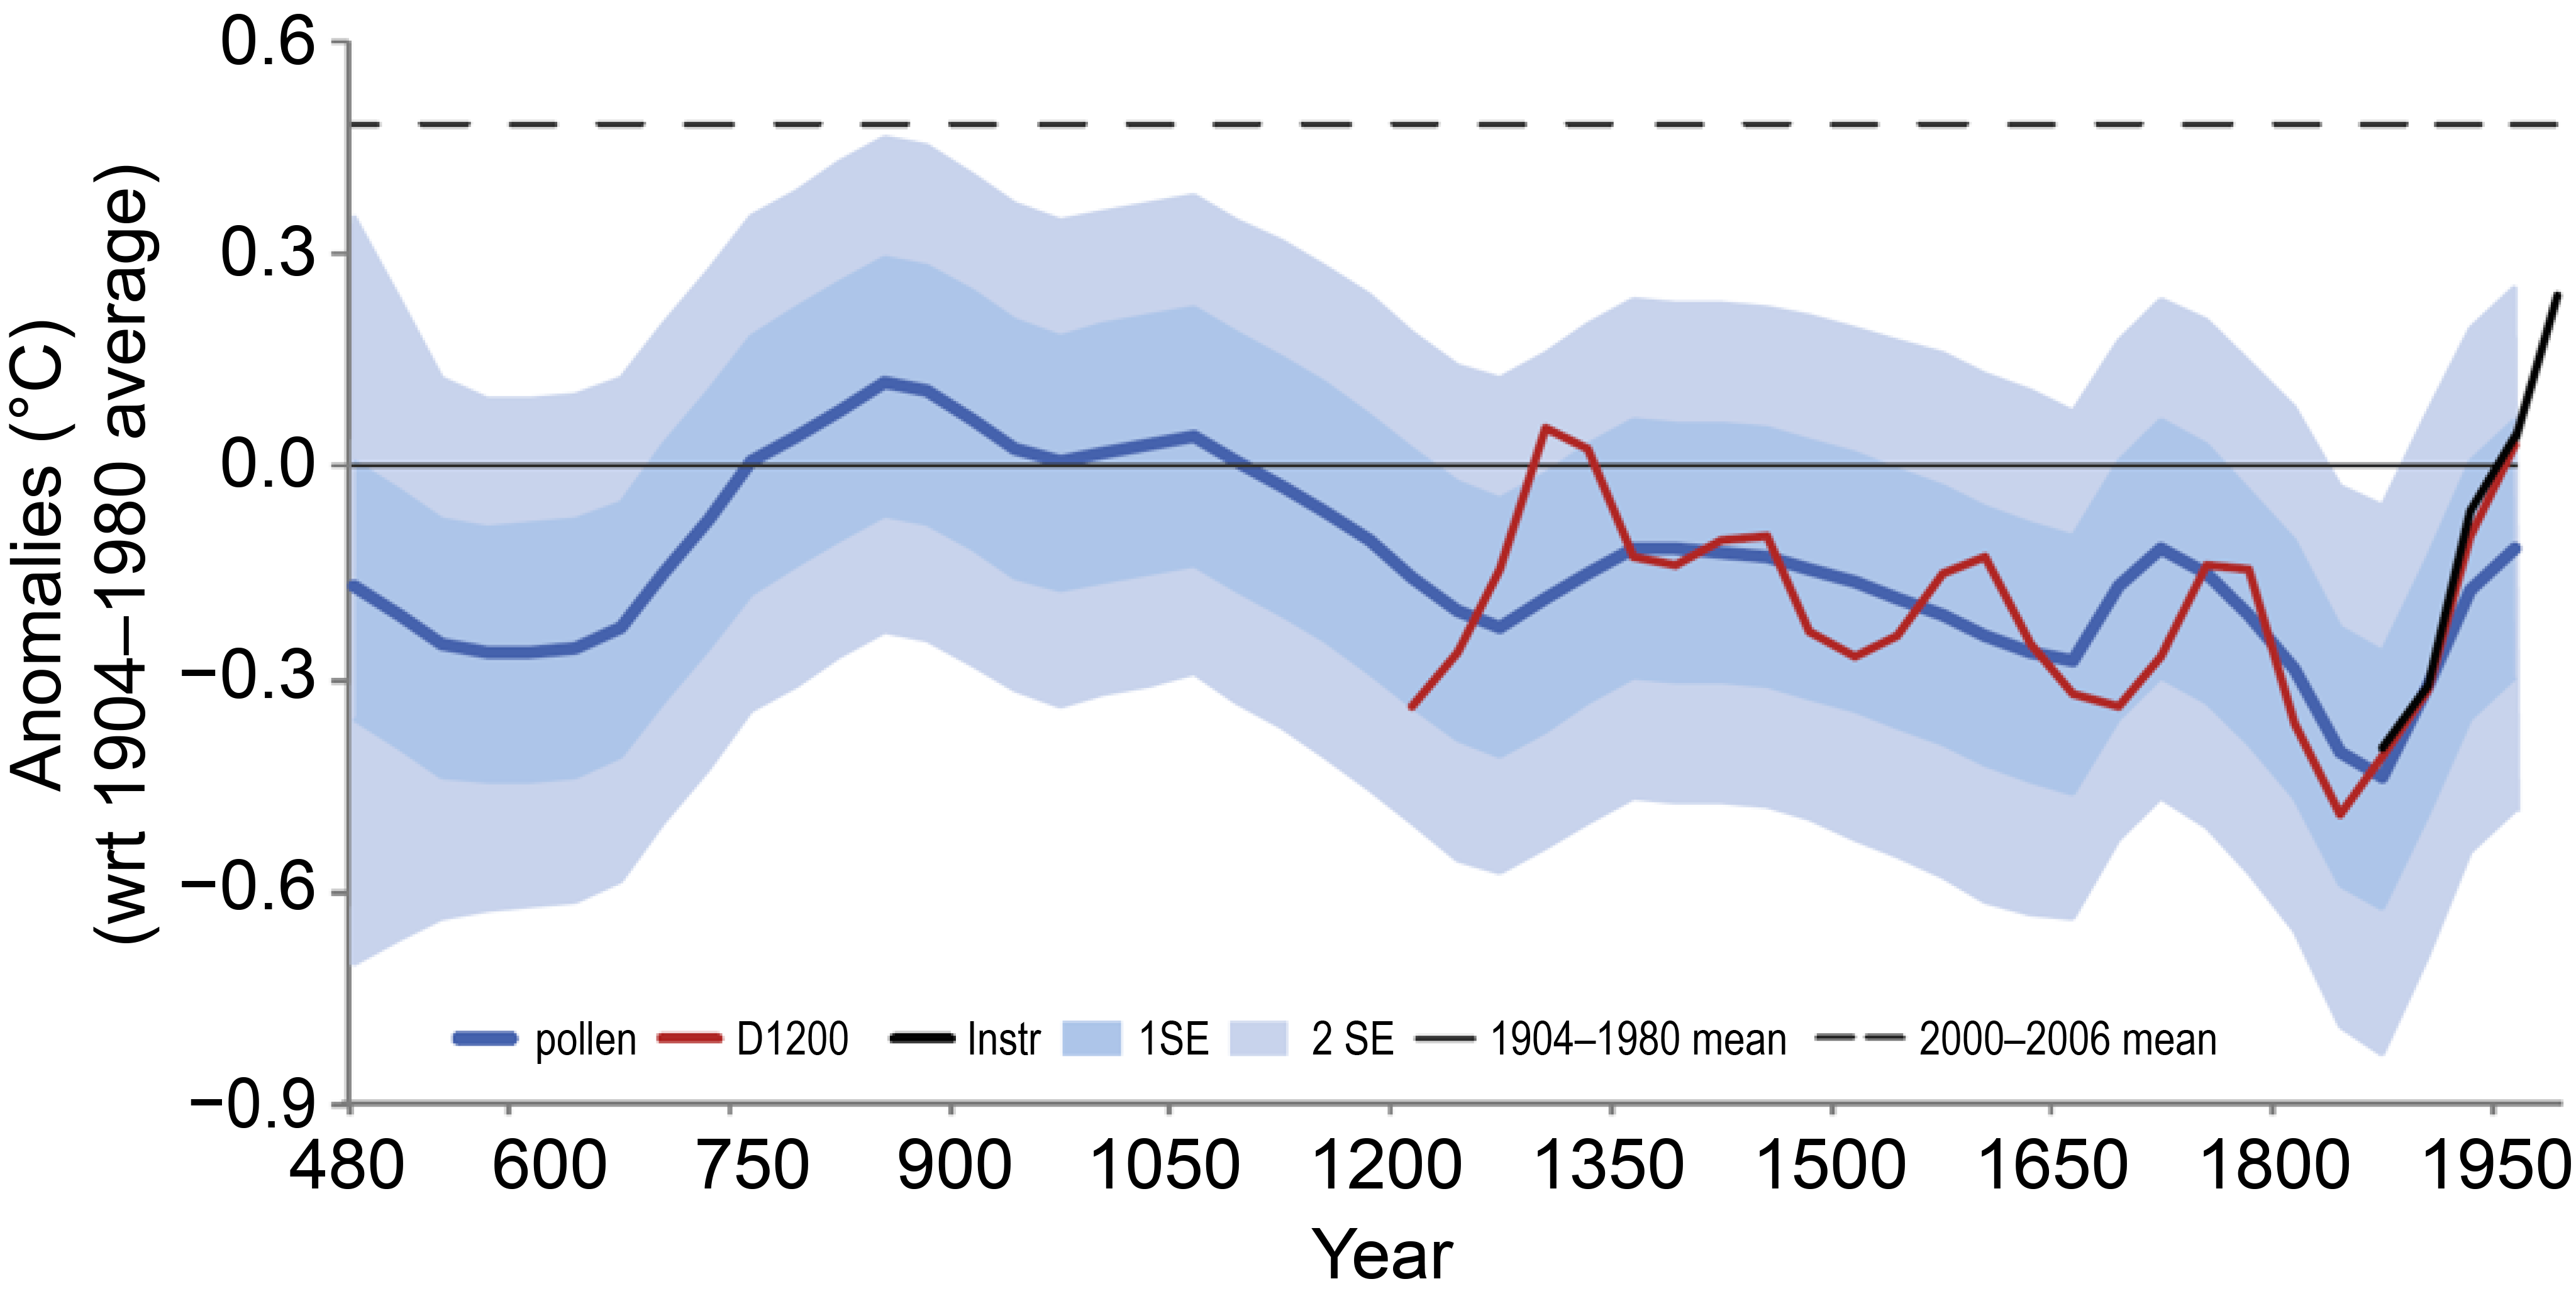
Pollen-based temperature reconstruction for temperate North America. The blue curve depicts the pollen-based reconstruction of 30-year averages (as anomalies from 1904 to 1980) for the temperate region (30°–55°N, 75°–130°W). The red curve shows the corresponding tree ring-based decadal average reconstruction, which was smoothed and used to calibrate the lower-frequency pollen-based estimate. Light (medium) blue zones indicate 2 standard error (1 standard error) uncertainty estimations associated with each 30-year value. The black curve shows comparably smoothed instrumental temperature values up to 1980. The dashed black line represents the average temperature anomaly of comparably smoothed instrumental data for the period 2000–2006. (Figure source: NOAA NCEI).
Shifts in temperature extremes are examined using a suite of societally relevant climate change indices14 ,15 derived from long-term observations of daily surface temperature.16 The coldest and warmest temperatures of the year are of particular relevance given their widespread use in engineering, agricultural, and other sectoral applications (for example, extreme annual design conditions by the American Society of Heating, Refrigeration, and Air Conditioning; plant hardiness zones by the U.S. Department of Agriculture). Cold waves and heat waves (that is, extended periods of below or above normal temperature) are likewise of great importance because of their numerous societal and environmental impacts, which span from human health to plant and animal phenology. Changes are considered for a spectrum of event frequencies and intensities, ranging from the typical annual extreme to the 1-in-10 year event (an extreme that only has a 10% chance of occurrence in any given year). The discussion focuses on the contiguous United States; Alaska, Hawai‘i, and the Caribbean do not have a sufficient number of long-term stations for a century-scale analysis.
Cold extremes have become less severe over the past century. For example, the coldest daily temperature of the year has increased at most locations in the contiguous United States (Figure 6.3). All regions experienced net increases (Table 6.2), with the largest rises in the Northern Great Plains and the Northwest (roughly 4.5°F [2.5°C]), and the smallest in the Southeast (about 1.0°F [0.6°C]). In general, there were increases throughout the record, with a slight acceleration in recent decades (Figure 6.3). The temperature of extremely cold days (1-in-10 year events) generally exhibited the same pattern of increases as the coldest daily temperature of the year. Consistent with these increases, the number of cool nights per year (those with a minimum temperature below the 10th percentile for 1961–1990) declined in all regions, with much of the West having decreases of roughly two weeks. The frequency of cold waves (6-day periods with a minimum temperature below the 10th percentile for 1961–1990) has fallen over the past century (Figure 6.4). The frequency of intense cold waves (4-day, 1-in-5 year events) peaked in the 1980s and then reached record-low levels in the 2000s.17
| NCA Region | Change in Coldest Day of the Year | Change in Warmest Day of the Year |
|---|---|---|
| Northeast | 2.83°F | −0.92°F |
| Southeast | 1.13°F | −1.49°F |
| Midwest | 2.93°F | −2.22°F |
| Great Plains North | 4.40°F | −1.08°F |
| Great Plains South | 3.25°F | −1.07°F |
| Southwest | 3.99°F | 0.50°F |
| Northwest | 4.78°F | −0.17°F |
Figure 6.3
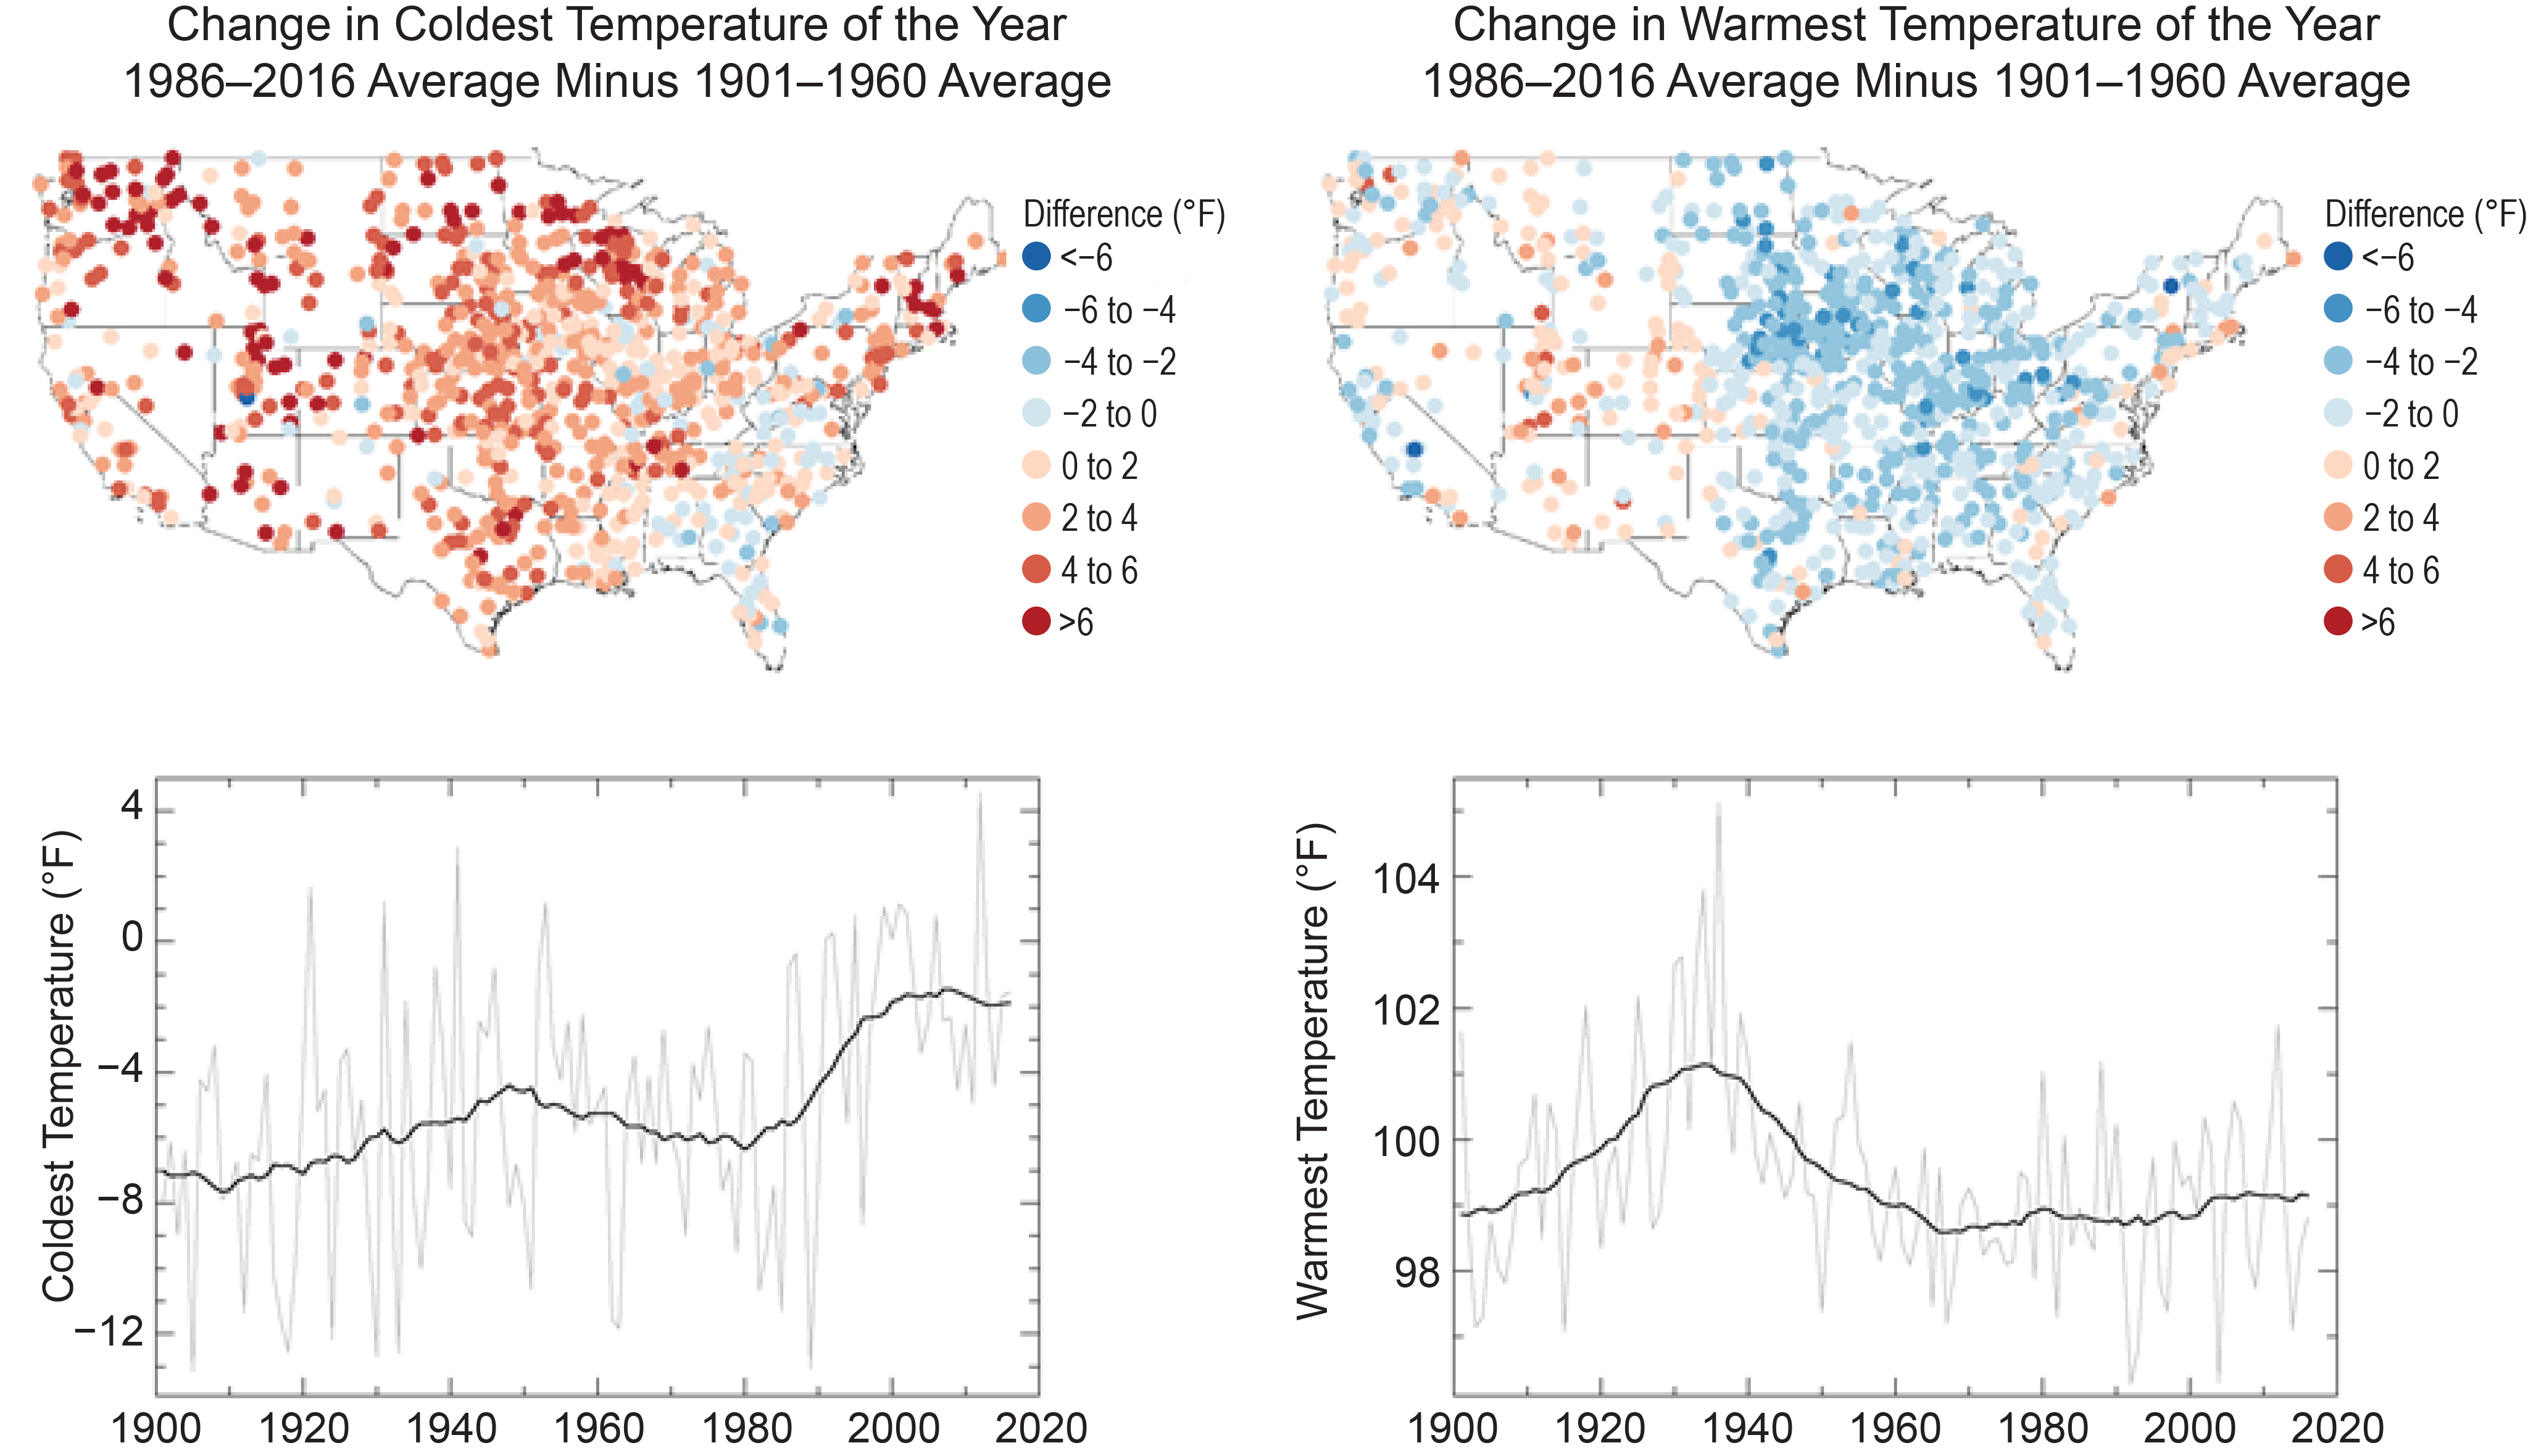
Observed changes in the coldest and warmest daily temperatures (°F) of the year in the contiguous United States. Maps (top) depict changes at stations; changes are the difference between the average for present-day (1986–2016) and the average for the first half of the last century (1901–1960). Time series (bottom) depict the area-weighted average for the contiguous United States. Estimates are derived from long-term stations with minimal missing data in the Global Historical Climatology Network–Daily dataset.16 (Figure source: NOAA/NCEI).
Figure 6.4
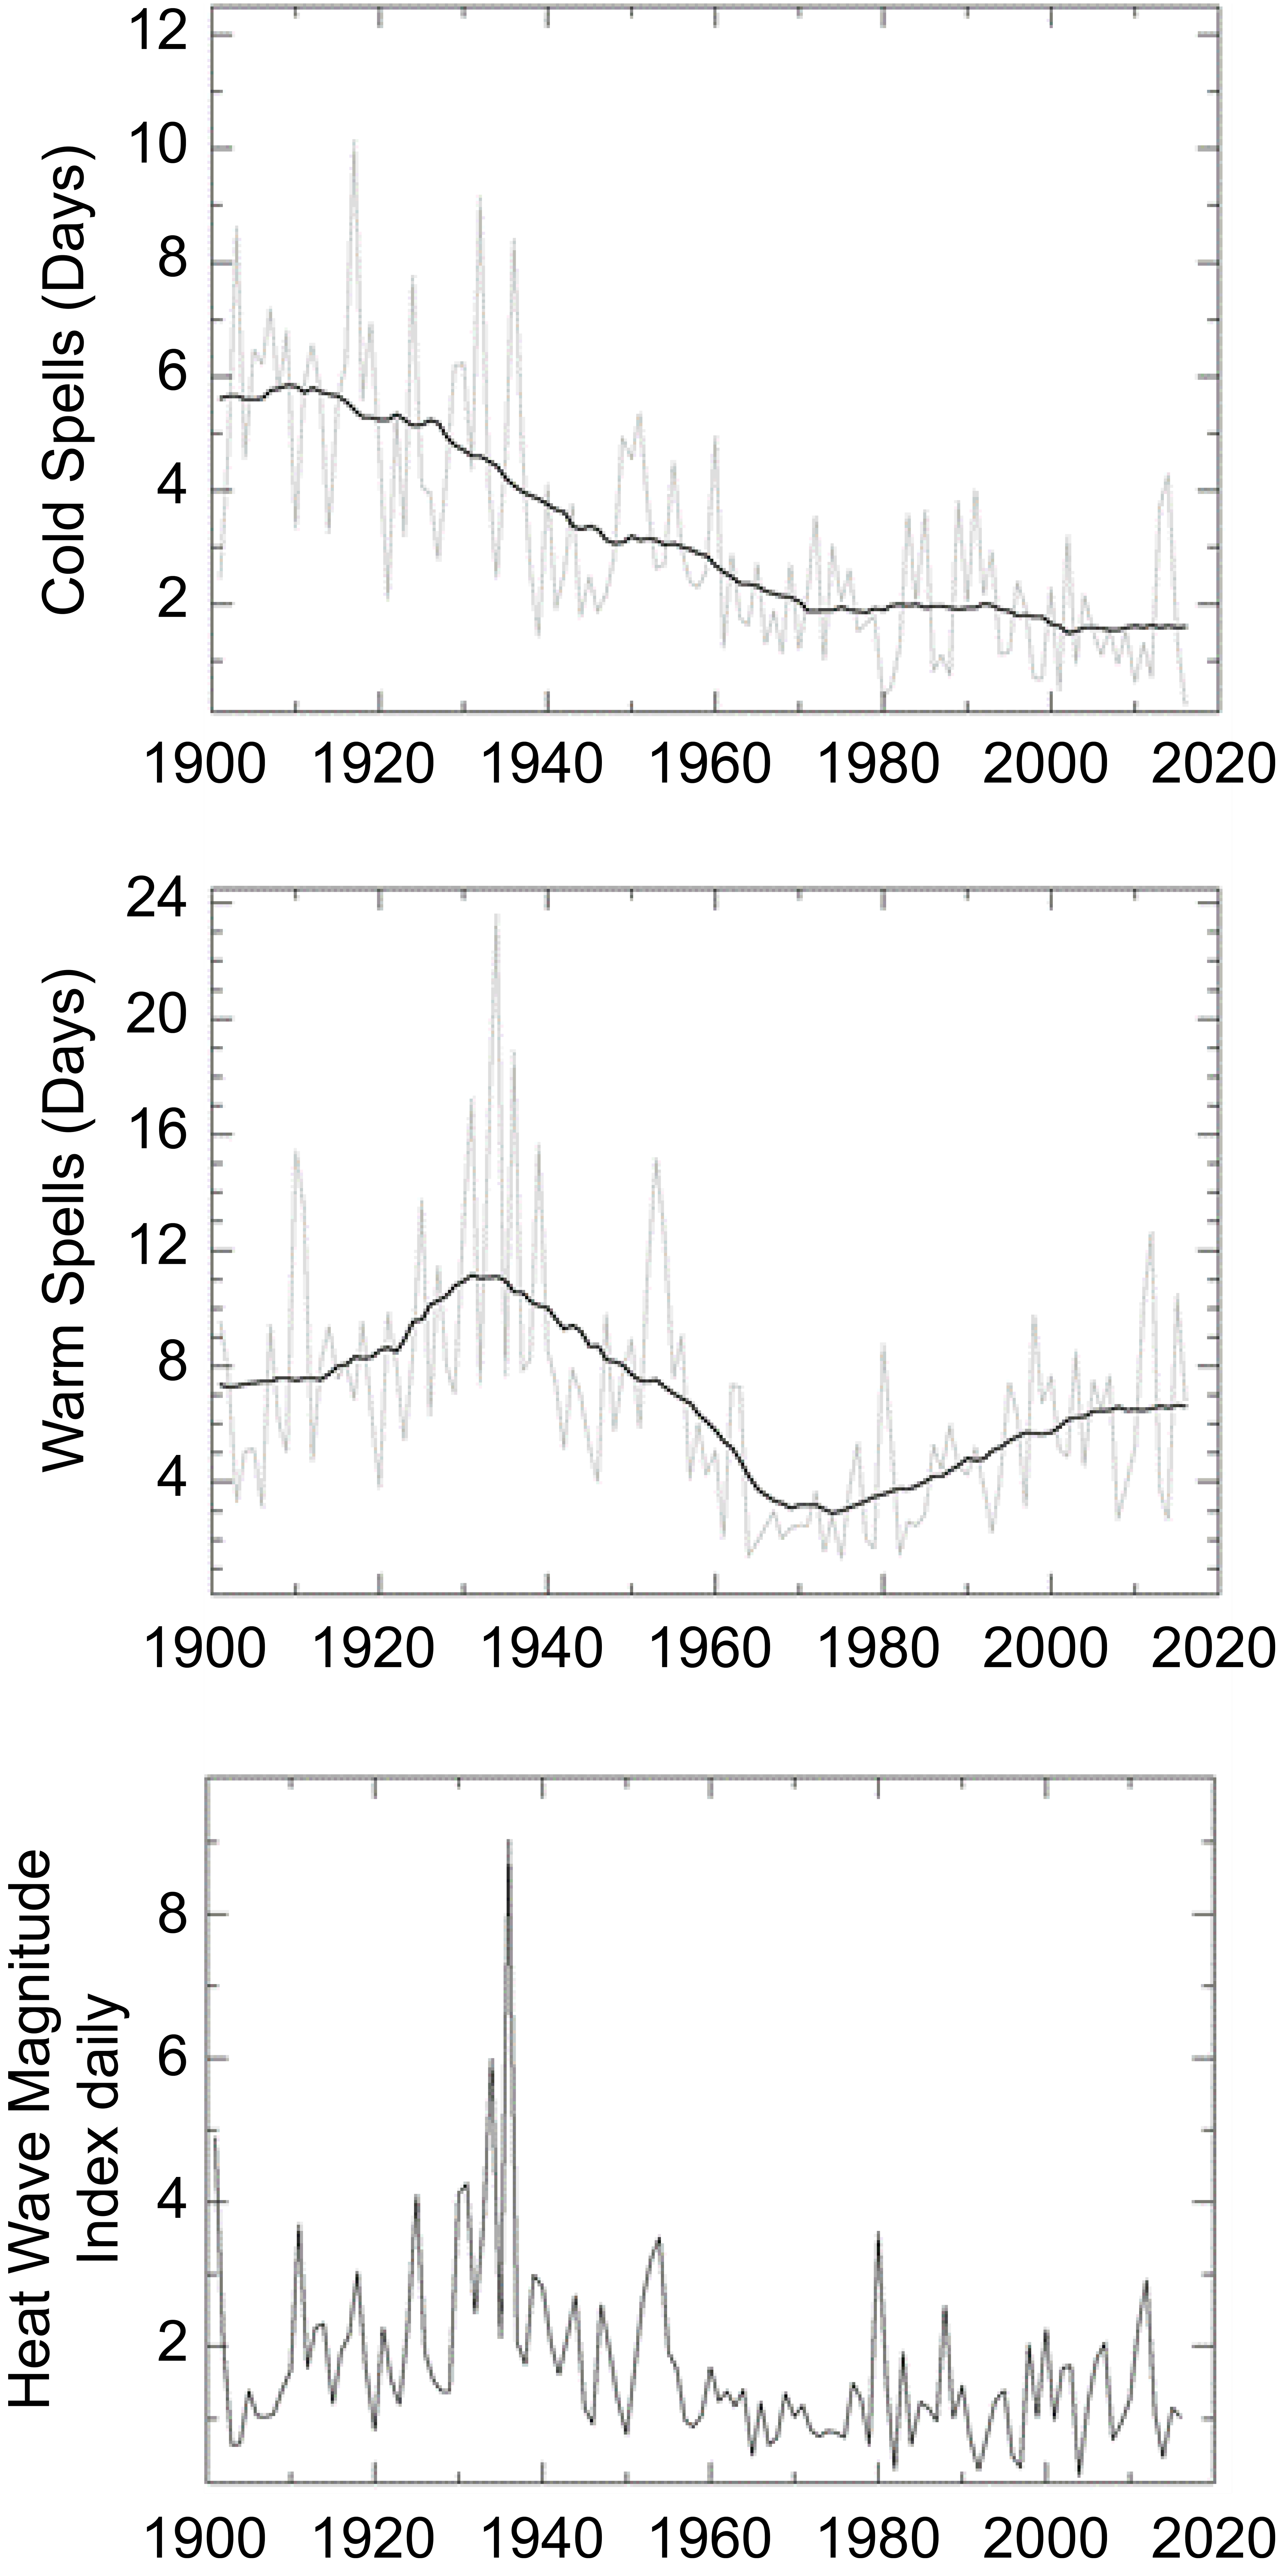
Observed changes in cold and heat waves in the contiguous United States. The top panel depicts changes in the frequency of cold waves; the middle panel depicts changes in the frequency of heat waves; and the bottom panel depicts changes in the intensity of heat waves. Cold and heat wave frequency indices are defined in Zhang et al.,15 and the heat wave intensity index is defined in Russo et al.14 Estimates are derived from long-term stations with minimal missing data in the Global Historical Climatology Network–Daily dataset.16 (Figure source: NOAA/NCEI).
Changes in warm extremes are more nuanced than changes in cold extremes. For instance, the warmest daily temperature of the year increased in some parts of the West over the past century (Figure 6.3), but there were decreases in almost all locations east of the Rocky Mountains. In fact, all eastern regions experienced a net decrease (Table 6.2), most notably the Midwest (about 2.2°F [1.2°C]) and the Southeast (roughly 1.5°F [0.8°C]). The decreases in the eastern half of Nation, particularly in the Great Plains, are mainly tied to the unprecedented summer heat of the 1930s Dust Bowl era, which was exacerbated by land-surface feedbacks driven by springtime precipitation deficits and land mismanagement.18 However, anthropogenic aerosol forcing may also have reduced summer temperatures in the Northeast and Southeast from the early 1950s to the mid-1970s,19 and agricultural intensification may have suppressed the hottest extremes in the Midwest.20 Since the mid-1960s, there has been only a very slight increase in the warmest daily temperature of the year (amidst large interannual variability). Heat waves (6-day periods with a maximum temperature above the 90th percentile for 1961–1990) increased in frequency until the mid-1930s, became considerably less common through the mid-1960s, and increased in frequency again thereafter (Figure 6.4). As with warm daily temperatures, heat wave magnitude reached a maximum in the 1930s. The frequency of intense heat waves (4-day, 1-in-5 year events) has generally increased since the 1960s in most regions except the Midwest and the Great Plains.17 ,21 Since the early 1980s (Figure 6.4), there is suggestive evidence of a slight increase in the intensity of heat waves nationwide14 as well as an increase in the concurrence of droughts and heat waves.22
Figure 6.5
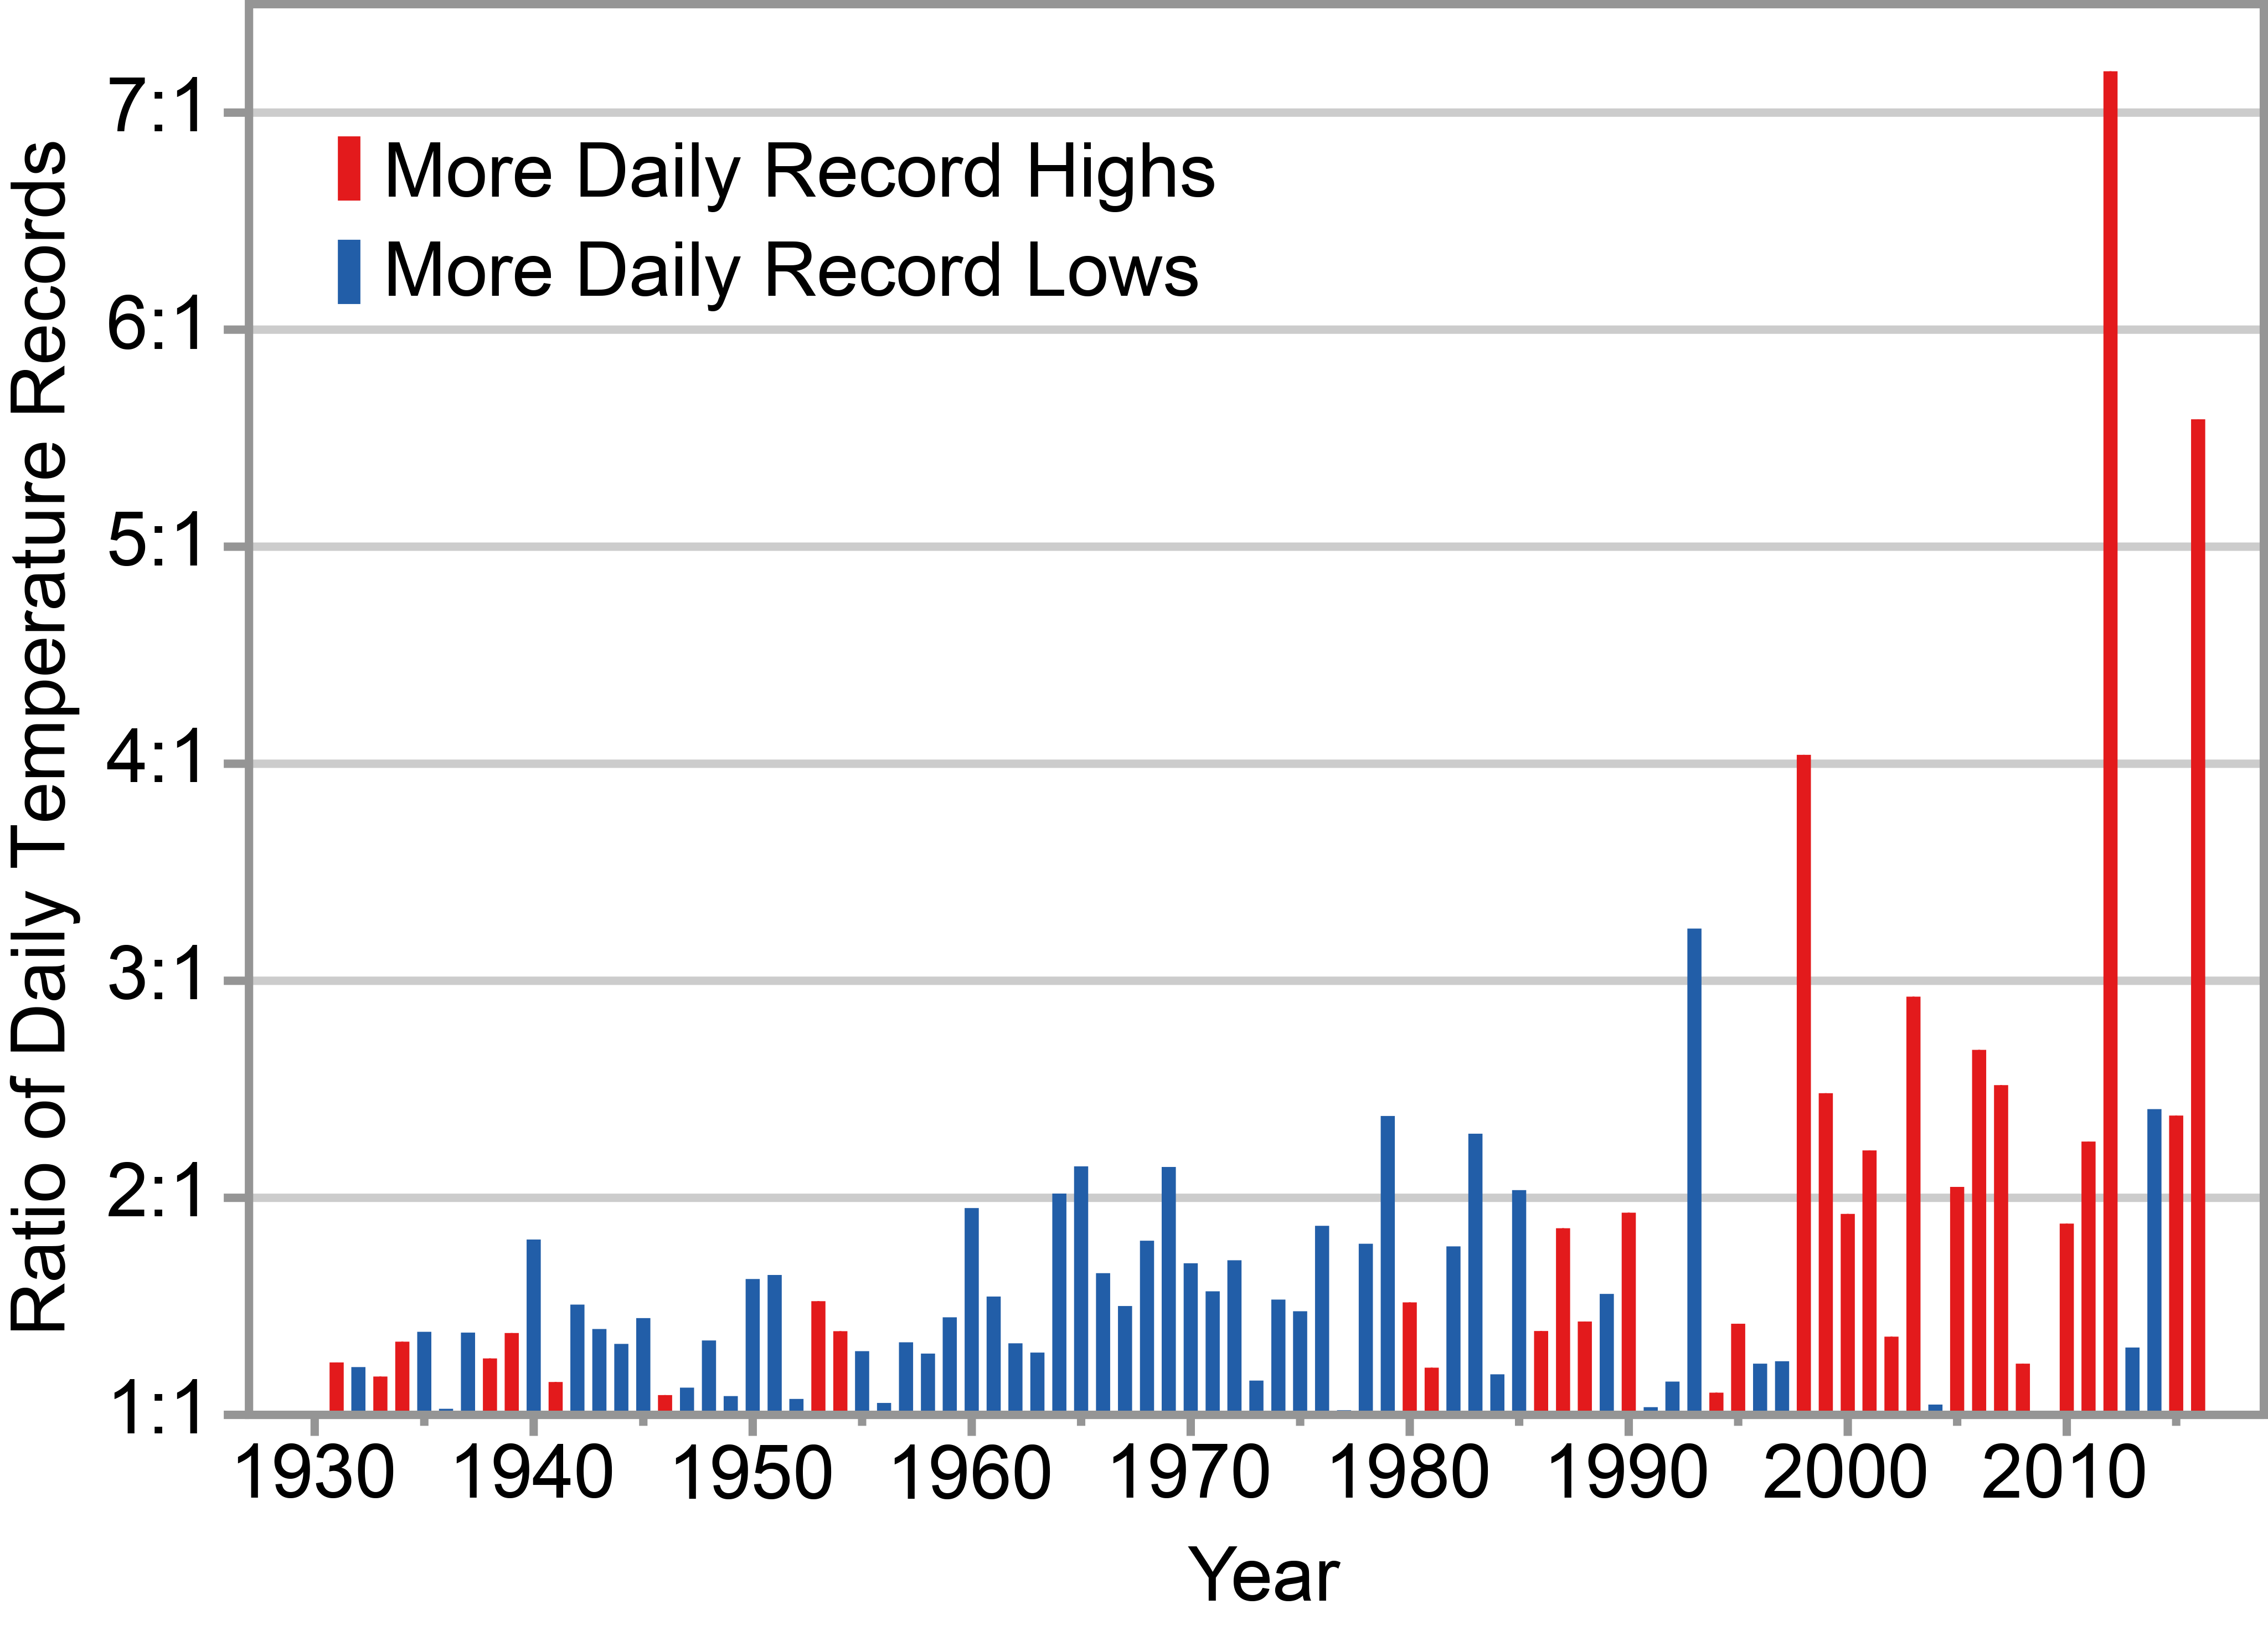
Observed changes in the occurrence of record-setting daily temperatures in the contiguous United States. Red bars indicate a year with more daily record highs than daily record lows, while blue bars indicate a year with more record lows than highs. The height of the bar indicates the ratio of record highs to lows (red) or of record lows to highs (blue). For example, a ratio of 2:1 for a blue bar means that there were twice as many record daily lows as daily record highs that year. Estimates are derived from long-term stations with minimal missing data in the Global Historical Climatology Network–Daily dataset.16
(Figure source: NOAA/NCEI).
Changes in the occurrence of record-setting daily temperatures are also apparent. Very generally, the number of record lows has been declining since the late-1970s while the number of record highs has been rising.23 By extension, there has been an increase in the ratio of the number of record highs to record lows (Figure 6.5). Over the past two decades, the average of this ratio exceeds two (meaning that twice as many high-temperature records have been set as low-temperature records). The number of new highs has surpassed the number of new lows in 15 of the last 20 years, with 2012 and 2016 being particularly extreme (ratios of seven and five, respectively).
6.2: Detection and Attribution
6.2.1 Average Temperatures
While a confident attribution of global temperature increases to anthropogenic forcing has been made,24 detection and attribution assessment statements for smaller regions are generally much weaker. Nevertheless, some detectable anthropogenic influences on average temperature have been reported for North America and parts of the United States (e.g., Christidis et al. 2010;25 Bonfils et al. 2008;26 Pierce et al. 200927 ). Figure 6.6 shows an example for linear trends for 1901–2015, indicating a detectable anthropogenic warming since 1901 over the western and northern regions of the contiguous United States for the CMIP5 multimodel ensemble—a condition that was also met for most of the individual models.28 The Southeast stands out as the only region with no “detectable” warming since 1901; observed trends there were inconsistent with CMIP5 All Forcing historical runs.28 The cause of this “warming hole,” or lack of a long-term warming trend, remains uncertain, though it is likely a combination of natural and human causes. Some studies conclude that changes in anthropogenic aerosols have played a crucial role (e.g., Leibensperger et al. 2012a,b;29 ,30 Yu et al. 201431 ), whereas other studies infer a possible large role for atmospheric circulation,32 internal climate variability (e.g., Meehl et al. 2012;8 Knutson et al. 2013a28 ), and changes in land use (e.g., Goldstein et al. 2009;33 Xu et al. 201534 ). Notably, the Southeast has been warming rapidly since the early 1960s.35 ,36 In summary, there is medium confidence for detectable anthropogenic warming over the western and northern regions of the contiguous United States.
Figure 6.6
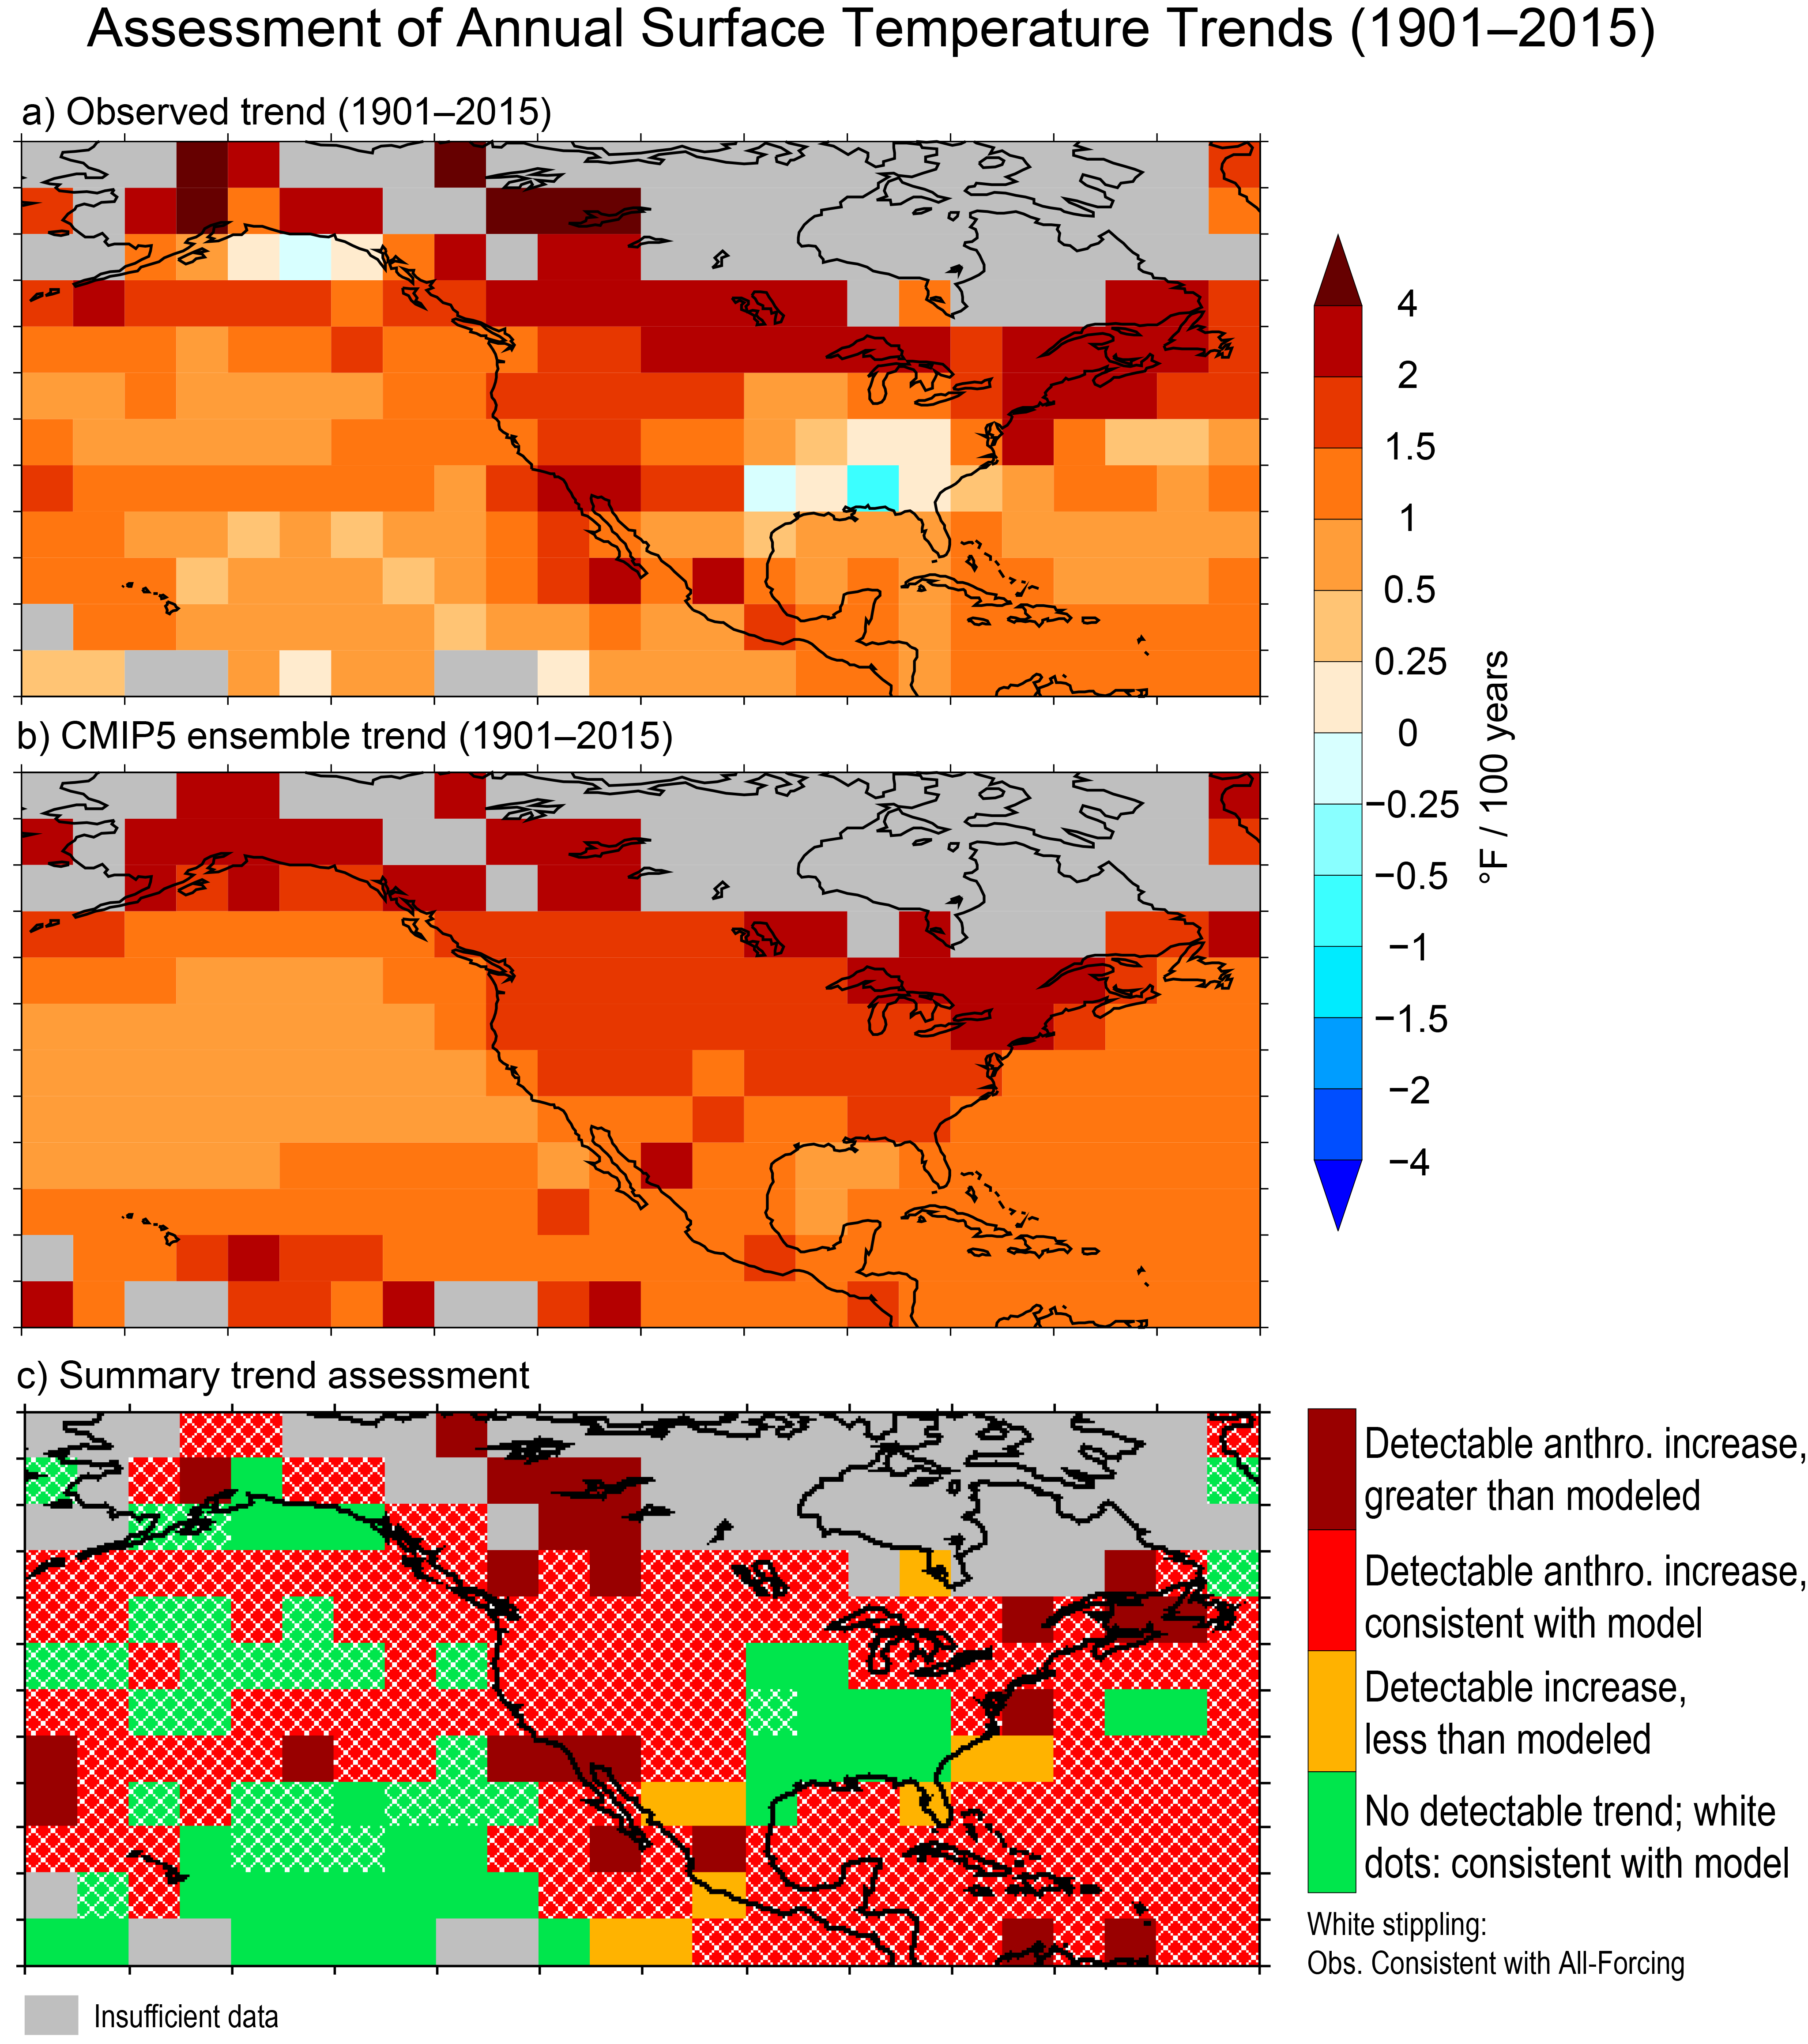
Detection and attribution assessment of trends in annual average temperature (°F). Grid-box values indicate whether linear trends for 1901–2015 are detectable (that is, distinct from natural variability) and/or consistent with CMIP5 historical All-Forcing runs. If the grid-box trend is found to be both detectable and either consistent with or greater than the warming in the All-Forcing runs, then the grid box is assessed as having a detectable anthropogenic contribution to warming over the period. Gray regions represent grid boxes with data that are too sparse for detection and attribution. (Figure source: updated from Knutson et al. 2013;28 © American Meteorological Society. Used with permission.)
6.2.2 Temperature Extremes
The Intergovernmental Panel on Climate Change’s (IPCC’s) Fifth Assessment Report (AR5)24 concluded that it is very likely that human influence has contributed to the observed changes in frequency and intensity of temperature extremes on the global scale since the mid-20th century. The combined influence of anthropogenic and natural forcings was also detectable (medium confidence) over large subregions of North America (e.g., Zwiers et al. 2011;37 Min et al. 201338 ). In general, however, results for the contiguous United States are not as compelling as for global land areas, in part because detection of changes in U.S. regional temperature extremes is affected by extreme temperature in the 1930s.17 Table 6.3 summarizes available attribution statements for recent extreme U.S. temperature events. As an example, the recent record or near-record high March–May average temperatures occurring in 2012 over the eastern United States were attributed in part to external (natural plus anthropogenic) forcing;39 the century-scale trend response of temperature to external forcing is typically a close approximation to the anthropogenic forcing response alone. Another study found that although the extreme March 2012 warm anomalies over the United States were mostly due to natural variability, anthropogenic warming contributed to the severity.40 Such statements reveal that both natural and anthropogenic factors influence the severity of extreme temperature events. Nearly every modern analysis of current extreme hot and cold events reveals some degree of attributable human influence.
| Study | Period | Region | Type | Statement |
|---|---|---|---|---|
| Rupp et al. 201252
Angélil et al. 201753 |
Spring/Summer 2011 | Texas | Hot | + + |
| Hoerling et al. 201354 | Summer 2011 | Texas | Hot | + |
| Diffenbaugh and Scherer 201355
Angélil et al. 201753 |
July 2012 | Northcentral and Northeast | Hot | + + |
| Cattiaux and Yiou 201356
Angélil et al. 201753 |
Spring 2012 | East | Hot | 0 + |
| Knutson et al. 2013b39
Angelil et al. 201753 |
Spring 2012 | East | Hot | + + |
| Jeon et al 201657 | Summer 2011 | Texas/Oklahoma | Hot | + |
| Dole et al. 201440 | March 2012 | Upper Midwest | Hot | + |
| Seager et al. 201458 | 2011-2014 | California | Hot | + |
| Wolter et al. 201559 | Winter 2014 | Midwest | Cold | − |
| Trenary et al. 201560 | Winter 2014 | East | Cold | 0 |
6.3: Projected Changes
6.3.1 Average Temperatures
Temperature projections are based on global model results and associated downscaled products from CMIP5 using a suite of Representative Concentration Pathways (RCPs). In contrast to NCA3, model weighting is employed to refine projections of temperature for each RCP (Ch. 4: Projections; Appendix B: Model Weighting). Weighting parameters are based on model independence and skill over North America for seasonal temperature and annual extremes. Unless stated otherwise, all changes presented here represent the weighted multimodel mean. The weighting scheme helps refine confidence and likelihood statements, but projections of U.S. surface air temperature remain very similar to those in NCA3. Generally speaking, extreme temperatures are projected to increase even more than average temperatures.41
The annual average temperature of the contiguous United States is projected to rise throughout the century. Increases for the period 2021–2050 relative to 1976–2005 are projected to be about 2.5°F (1.4°C) for a lower scenario (RCP4.5) and 2.9°F (1.6°C) for the higher scenario (RCP8.5); the similarity in warming reflects the similarity in greenhouse gas concentrations during this period (Figure 4.1). Notably, a 2.5°F (1.4°C) increase makes the near-term average comparable to the hottest year in the historical record (2012). In other words, recent record-breaking years may be “common” in the next few decades. By late-century (2071–2100), the RCPs diverge significantly, leading to different rates of warming: approximately 5.0°F (2.8°C) for RCP4.5 and 8.7°F (4.8°C) for RCP8.5. Likewise, there are different ranges of warming for each scenario: 2.8°–7.3°F (1.6°–4.1°C) for RCP4.5 and 5.8°–11.9°F (3.2°–6.6°C) for RCP8.5. (The range is defined here as the difference between the average increase in the three coolest models and the average increase in the three warmest models.) For both RCPs, slightly greater increases are projected in summer than winter (except for Alaska), and average maximums will rise slightly faster than average minimums (except in the Southeast and Southern Great Plains).
Figure 6.7
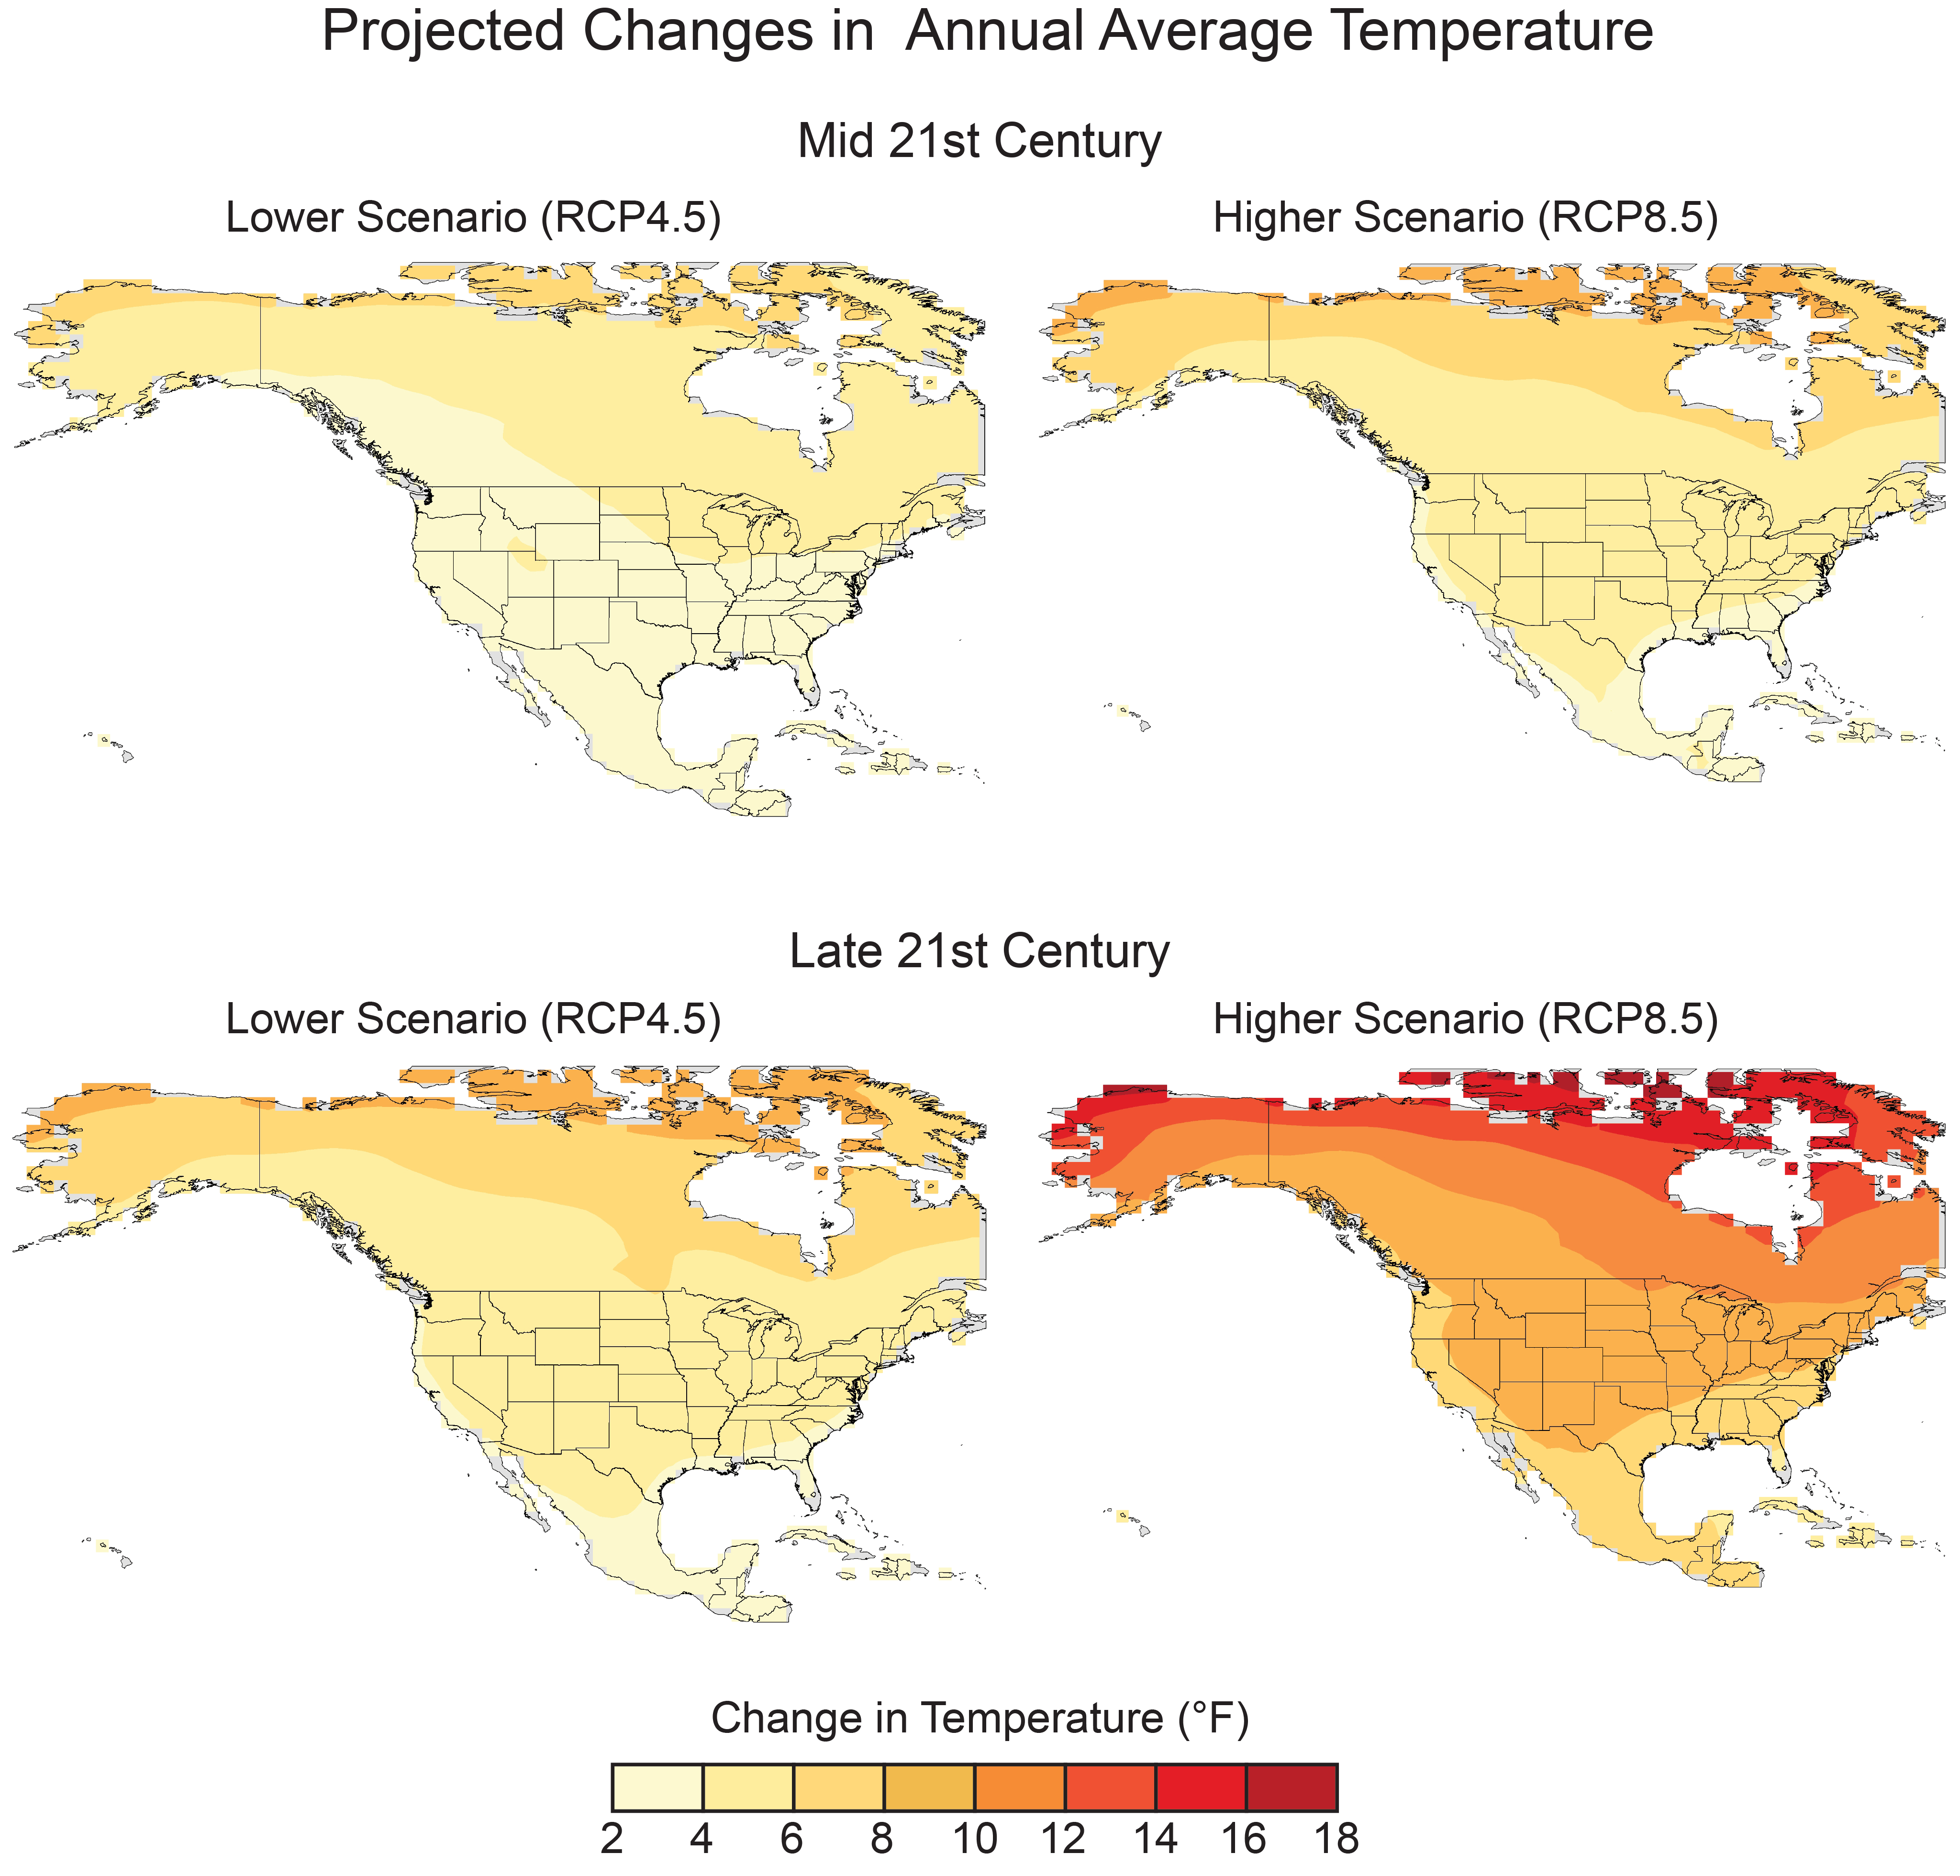
Projected changes in annual average temperatures (°F). Changes are the difference between the average for mid-century (2036–2065; top) or late-century (2070-2099, bottom) and the average for near-present (1976–2005). Each map depicts the weighted multimodel mean. Increases are statistically significant in all areas (that is, more than 50% of the models show a statistically significant change, and more than 67% agree on the sign of the change45 ). (Figure source: CICS-NC and NOAA NCEI).
Statistically significant warming is projected for all parts of the United States throughout the century (Figure 6.7). Consistent with polar amplification, warming rates (and spatial gradients) are greater at higher latitudes. For example, warming is largest in Alaska (more than 12.0°F [6.7°C] in the northern half of the state by late-century under RCP8.5), driven in part by a decrease in snow cover and thus surface albedo. Similarly, northern regions of the contiguous United States have slightly more warming than other regions (roughly 9.0°F [5.5°C] in the Northeast, Midwest, and Northern Great Plains by late-century under RCP8.5; Table 6.4). The Southeast has slightly less warming because of latent heat release from increases in evapotranspiration (as is already evident in the observed record). Warming is smallest in Hawai‘i and the Caribbean (roughly 4.0°–6.0°F [2.2°–3.3°C] by late century under RCP8.5) due to the moderating effects of surrounding oceans. From a sub-regional perspective, less warming is projected along the coasts of the contiguous United States, again due to maritime influences, although increases are still substantial. Warming at higher elevations may be underestimated because the resolution of the CMIP5 models does not capture orography in detail.
| NCA Region | RCP4.5 Mid-Century (2036–2065) |
RCP8.5 Mid-Century (2036–2065) |
RCP4.5 Late-Century (2071–2100) |
RCP8.5 Late-Century (2071–2100) |
|---|---|---|---|---|
| Northeast | 3.98°F | 5.09°F | 5.27°F | 9.11°F |
| Southeast | 3.40°F | 4.30°F | 4.43°F | 7.72°F |
| Midwest | 4.21°F | 5.29°F | 5.57°F | 9.49°F |
| Great Plains North | 4.05°F | 5.10°F | 5.44°F | 9.37°F |
| Great Plains South | 3.62°F | 4.61°F | 4.78°F | 8.44°F |
| Southwest | 3.72°F | 4.80°F | 4.93°F | 8.65°F |
| Northwest | 3.66°F | 4.67°F | 4.99°F | 8.51°F |
6.3.2 Temperature Extremes
Figure 6.8
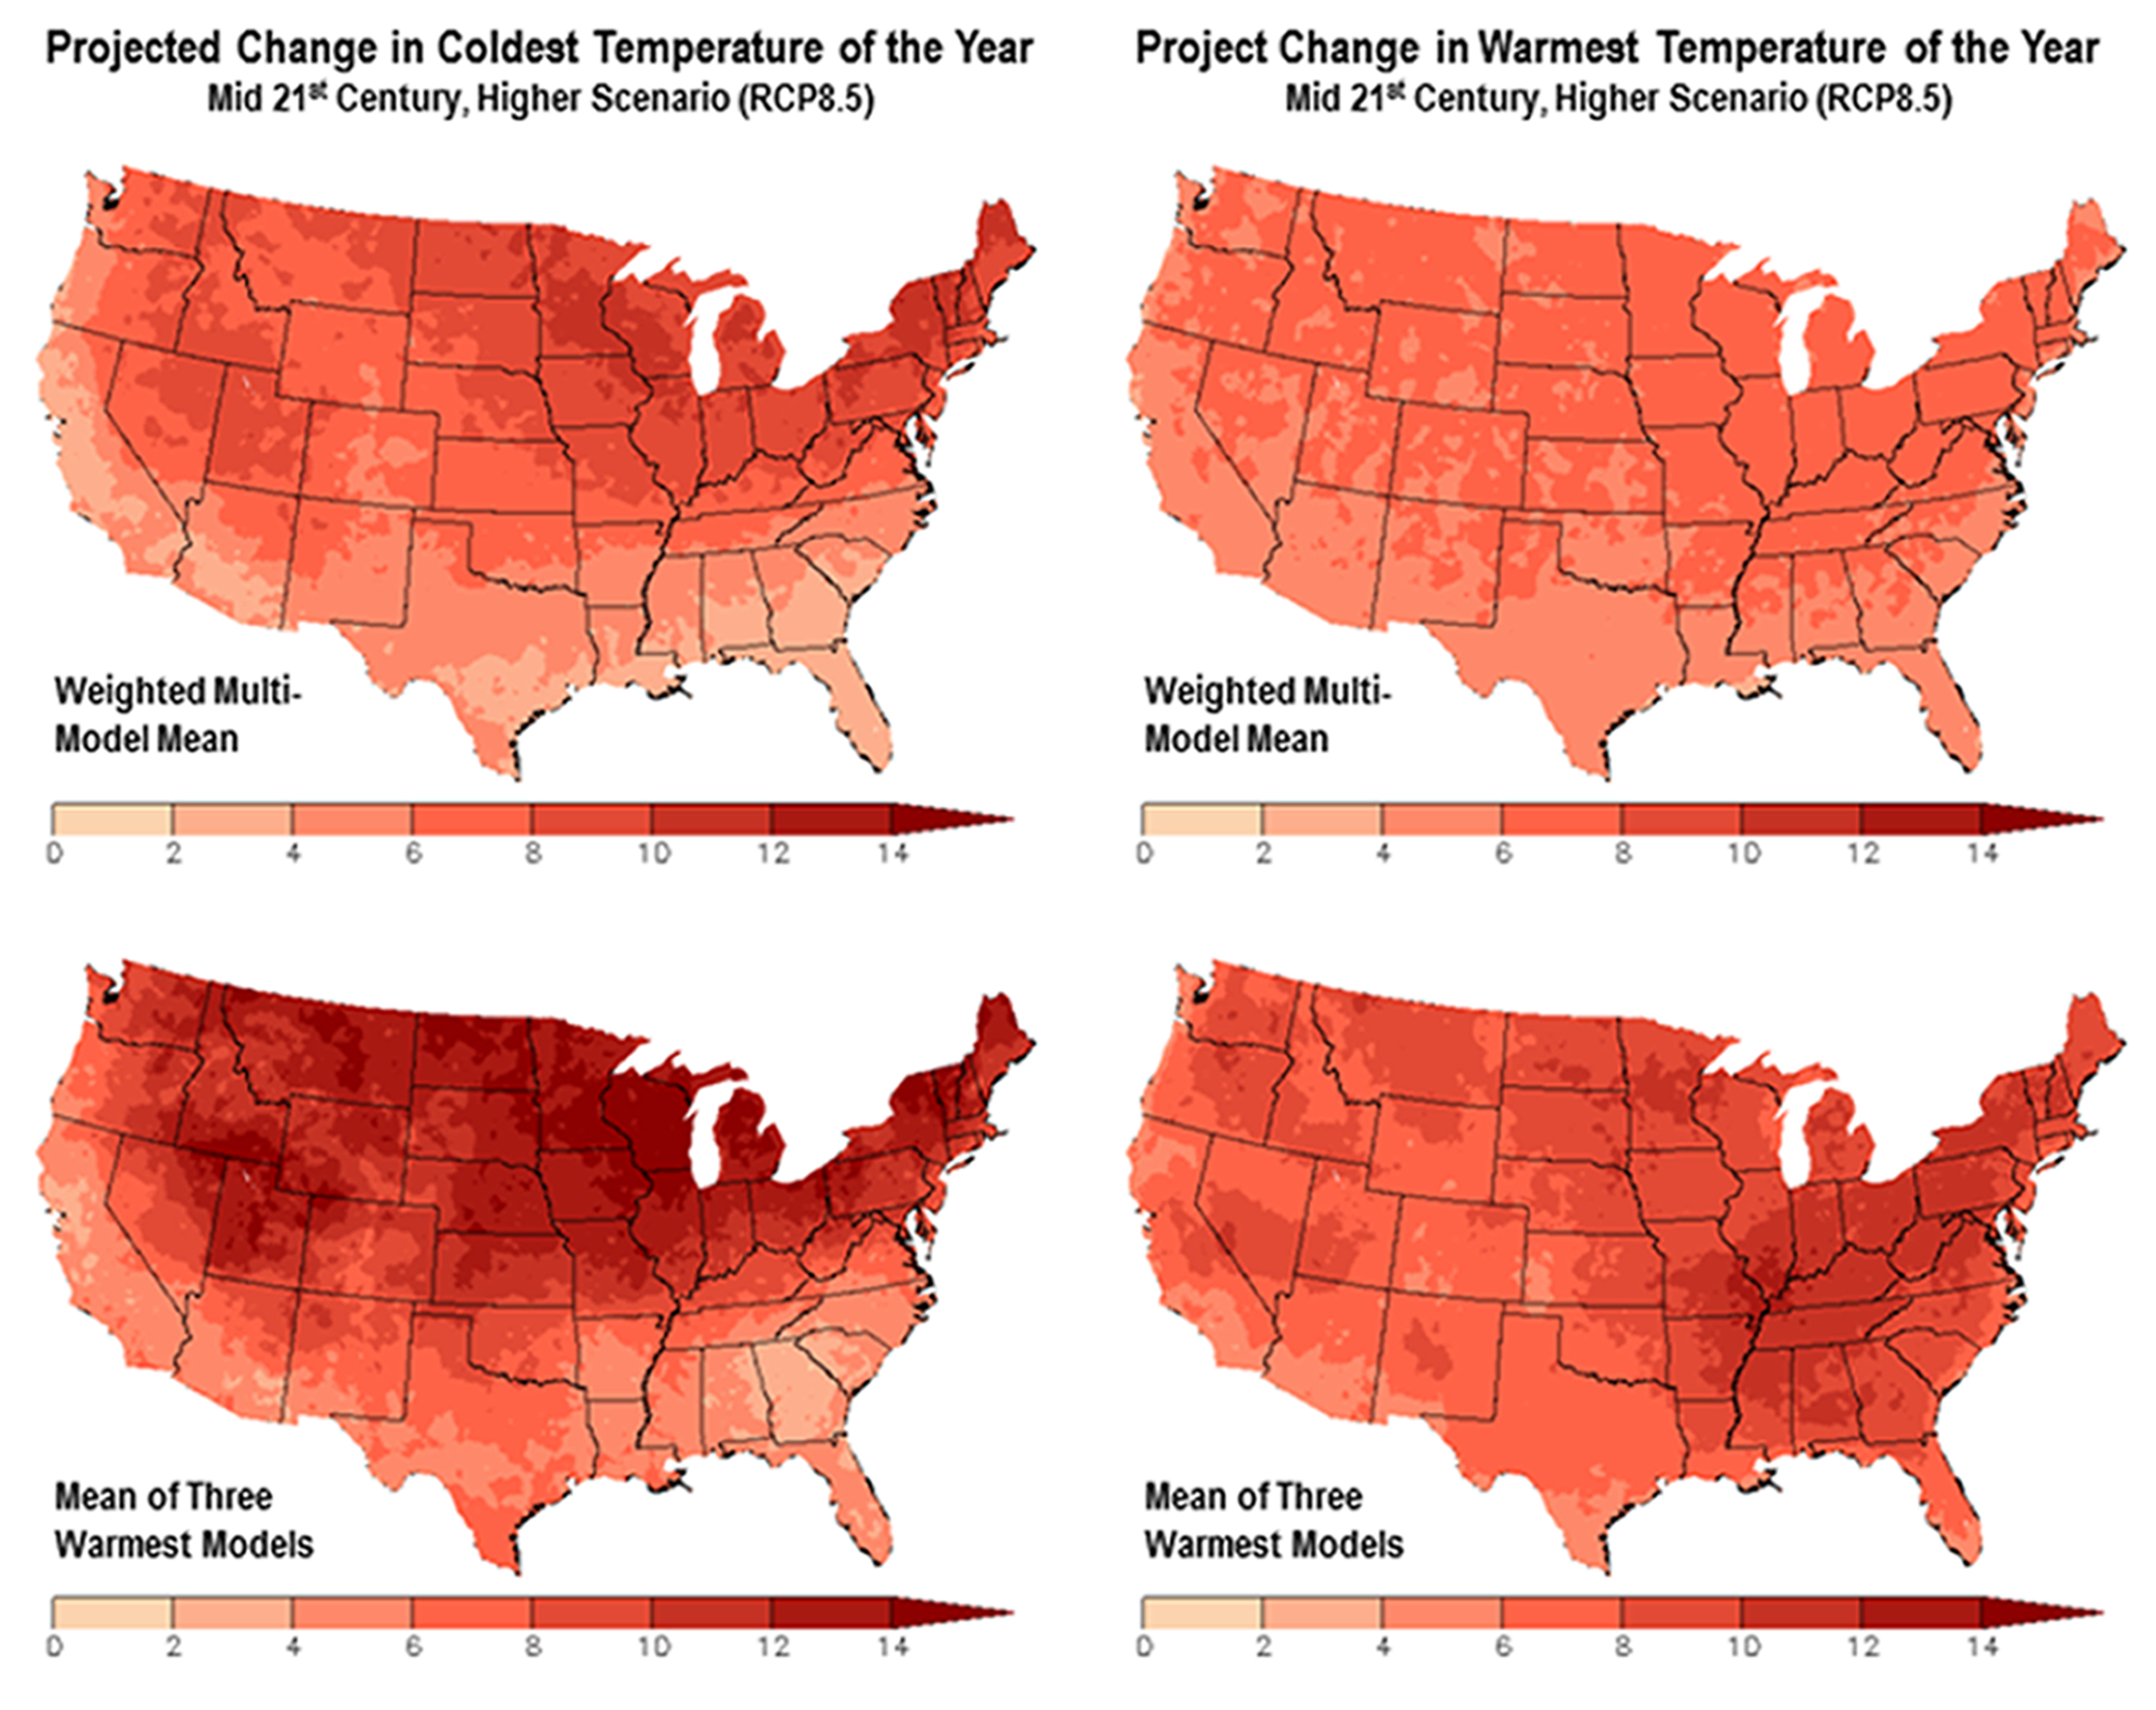
Projected changes in the coldest and warmest daily temperatures (°F) of the year in the contiguous United States. Changes are the difference between the average for mid-century (2036–2065) and the average for near-present (1976–2005) under the higher scenario (RCP8.5). Maps in the top row depict the weighted multimodel mean whereas maps on the bottom row depict the mean of the three warmest models (that is, the models with the largest temperature increase). Maps are derived from 32 climate model projections that were statistically downscaled using the Localized Constructed Analogs technique.51 Increases are statistically significant in all areas (that is, more than 50% of the models show a statistically significant change, and more than 67% agree on the sign of the change45 ). (Figure source: CICS-NC and NOAA NCEI).
Daily extreme temperatures are projected to increase substantially in the contiguous United States, particularly under the higher scenario (RCP8.5). For instance, the coldest and warmest daily temperatures of the year are expected to increase at least 5°F (2.8°C) in most areas by mid-century,42 rising to 10°F (5.5°C) or more by late-century.43 In general, there will be larger increases in the coldest temperatures of the year, especially in the northern half of the Nation, whereas the warmest temperatures will exhibit somewhat more uniform changes geographically (Figure 6.8). By mid-century, the upper bound for projected changes (i.e., the average of the three warmest models) is about 2°F (1.1°C) greater than the weighted multimodel mean. On a regional basis, annual extremes (Table 6.5) are consistently projected to rise faster than annual averages (Table 6.4). Future changes in “very rare” extremes are also striking; by late century, current 1-in-20 year maximums are projected to occur every year, while current 1-in-20 year minimums are not expected to occur at all.44
| NCA Region | Change in Coldest Day of the Year | Change in Coldest 5-Day 1-in-10 Year Event | Change in Warmest Day of the Year | Change in Warmest 5-Day 1-in-10 Year Event |
|---|---|---|---|---|
| Northeast | 9.51°F | 15.93°F | 6.51°F | 12.88°F |
| Southeast | 4.97°F | 8.84°F | 5.79°F | 11.09°F |
| Midwest | 9.44°F | 15.52°F | 6.71°F | 13.02°F |
| Great Plains North | 8.01°F | 12.01°F | 6.48°F | 12.00°F |
| Great Plains South | 5.49°F | 9.41°F | 5.70°F | 10.73°F |
| Southwest | 6.13°F | 10.20°F | 5.85°F | 11.17°F |
| Northwest | 7.33°F | 10.95°F | 6.25°F | 12.31°F |
The frequency and intensity of cold waves is projected to decrease while the frequency and intensity of heat waves is projected to increase throughout the century. The frequency of cold waves (6-day periods with a minimum temperature below the 10th percentile) will decrease the most in Alaska and the least in the Northeast while the frequency of heat waves (6-day periods with a maximum temperature above the 90th percentile) will increase in all regions, particularly the Southeast, Southwest, and Alaska. By mid-century, decreases in the frequency of cold waves are similar across RCPs whereas increases in the frequency of heat waves are about 50% greater in the higher scenario (RCP8.5) than the lower scenario (RCP4.5).45 The intensity of cold waves is projected to decrease while the intensity of heat waves is projected to increase, dramatically so under RCP8.5. By mid-century, both extreme cold waves and extreme heat waves (5-day, 1-in-10 year events) are projected to have temperature increases of at least 11.0°F (6.1°C) nationwide, with larger increases in northern regions (the Northeast, Midwest, Northern Great Plains, and Northwest; Table 6.5).
Figure 6.9
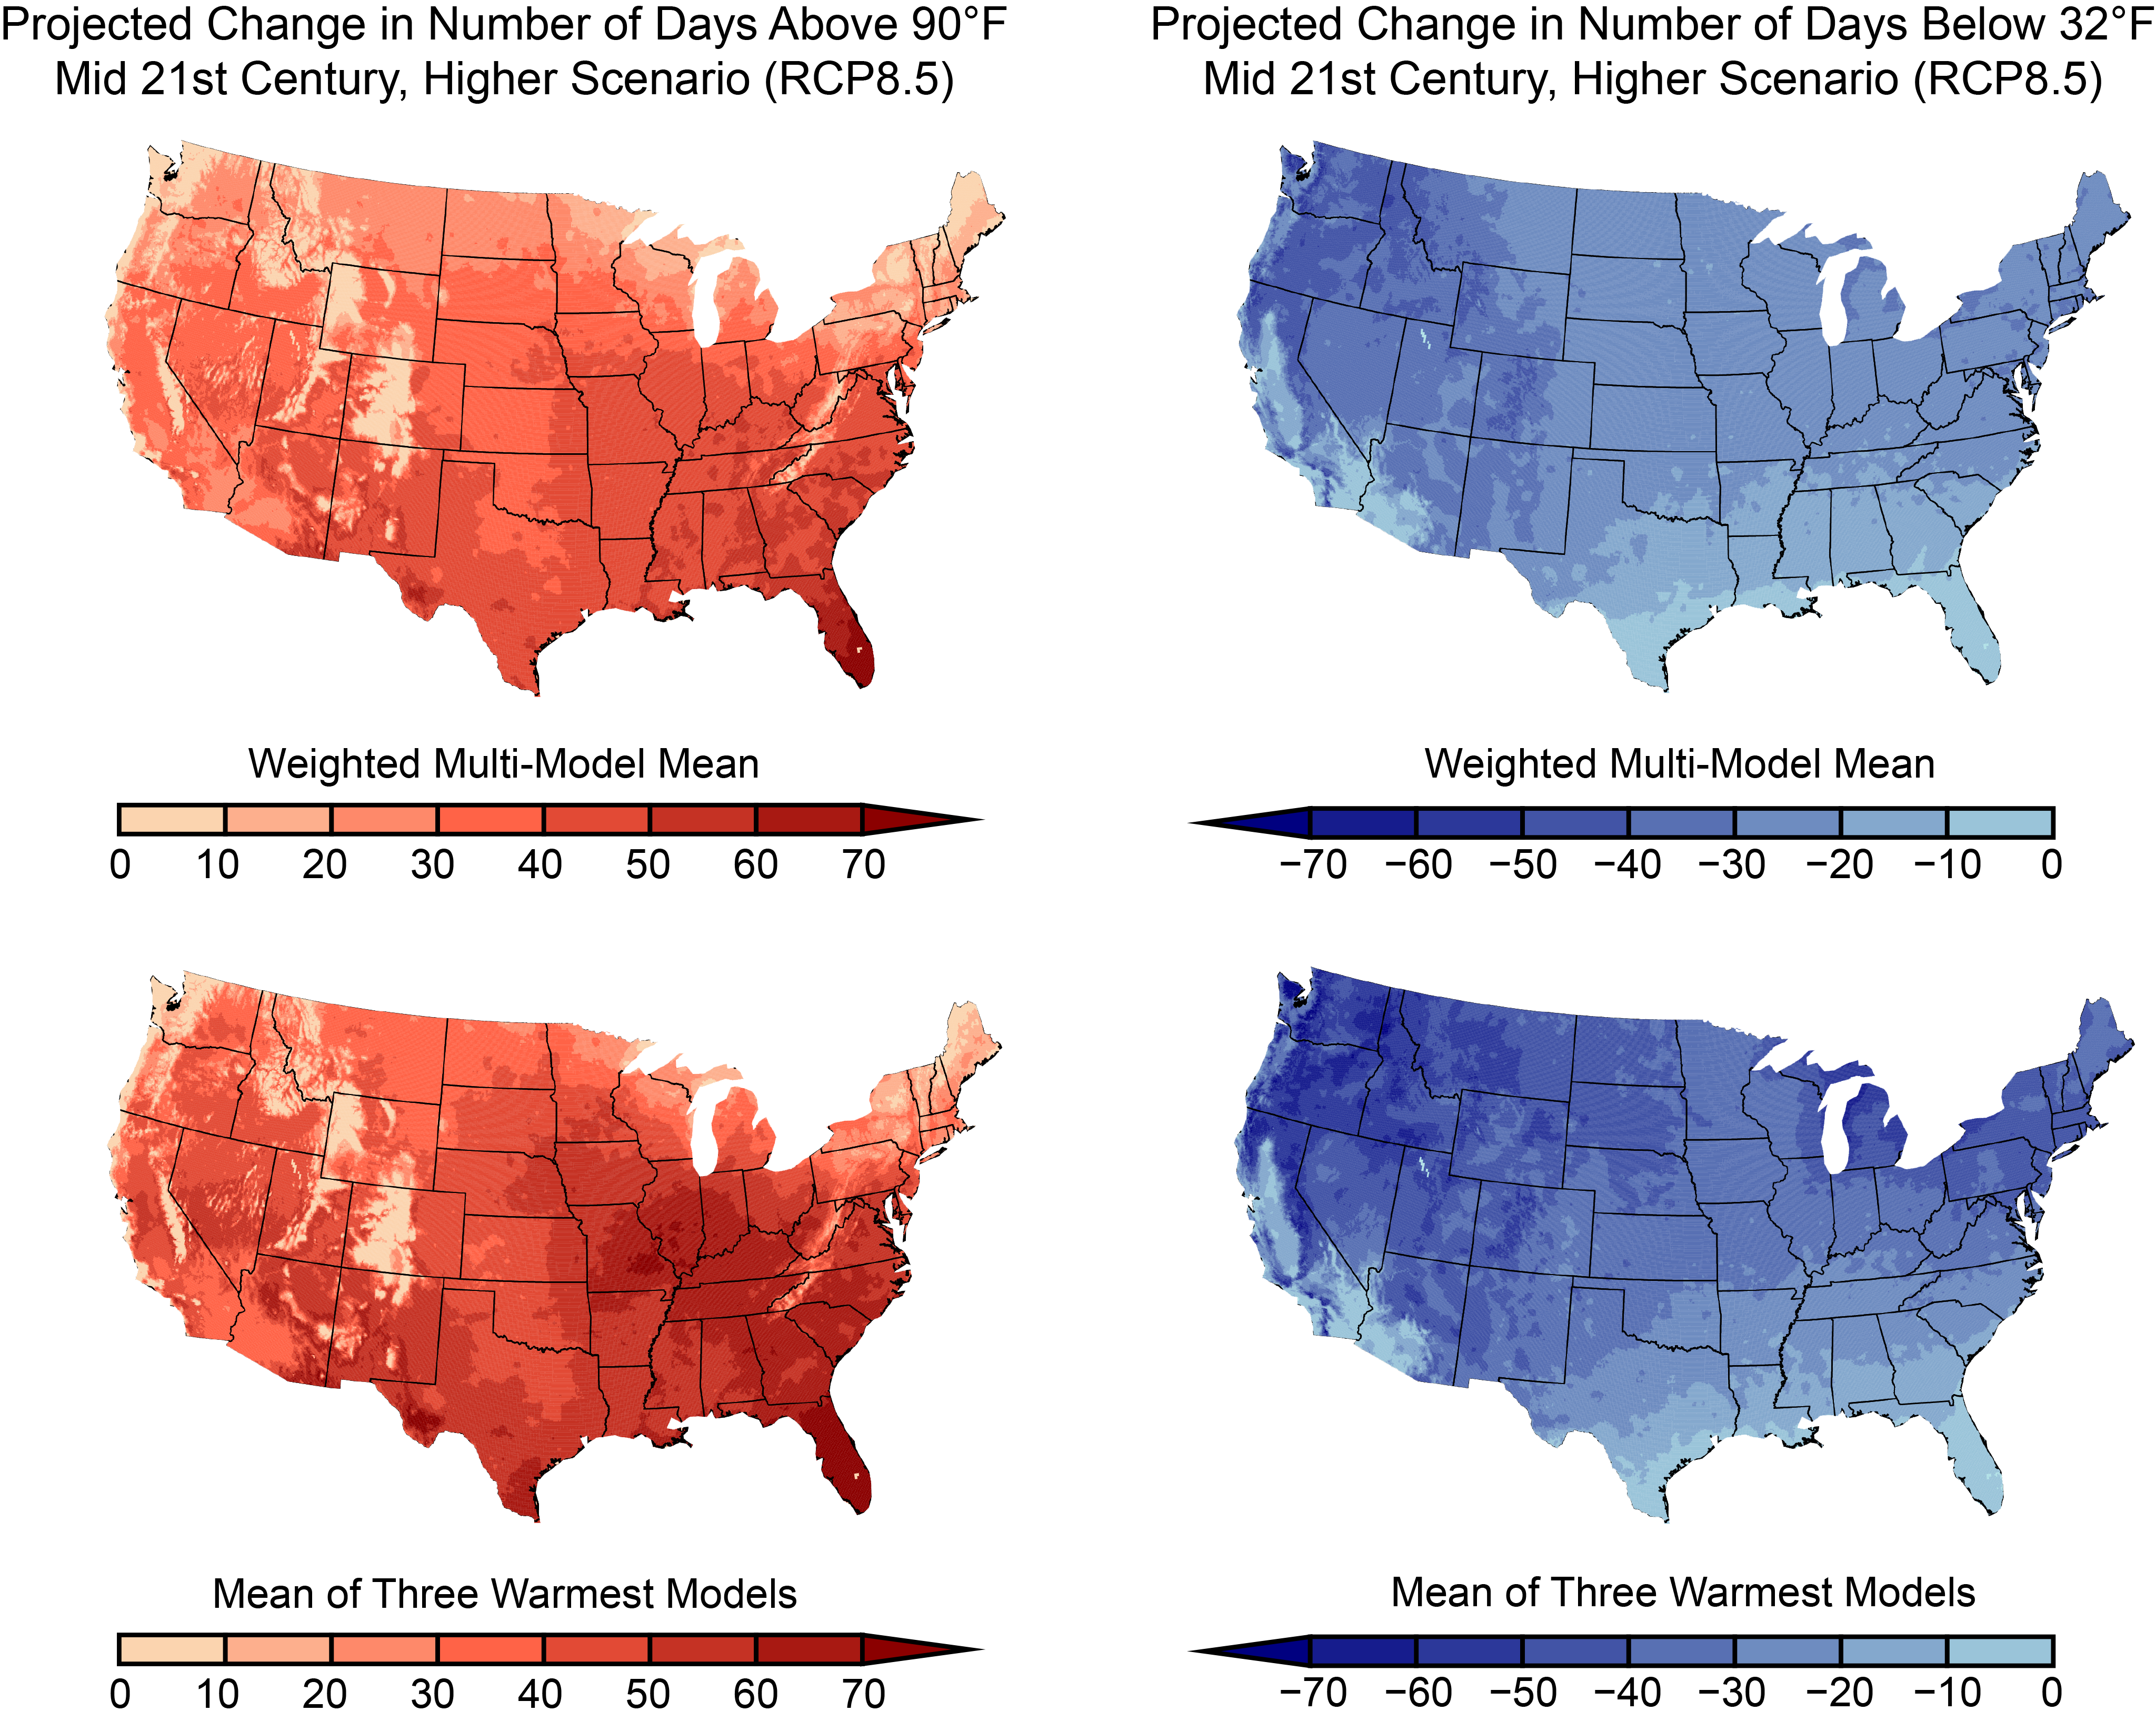
Projected changes in the number of days per year with a maximum temperature above 90°F and a minimum temperature below 32°F in the contiguous United States. Changes are the difference between the average for mid-century (2036–2065) and the average for near-present (1976–2005) under the higher scenario (RCP8.5). Maps in the top row depict the weighted multimodel mean whereas maps on the bottom row depict the mean of the three warmest models (that is, the models with the largest temperature increase). Maps are derived from 32 climate model projections that were statistically downscaled using the Localized Constructed Analogs technique.51 Changes are statistically significant in all areas (that is, more than 50% of the models show a statistically significant change, and more than 67% agree on the sign of the change45 ). (Figure source: CICS-NC and NOAA NCEI).
There are large projected changes in the number of days exceeding key temperature thresholds throughout the contiguous United States. For instance, there are about 20–30 more days per year with a maximum over 90°F (32°C) in most areas by mid-century under RCP8.5, with increases of 40–50 days in much of the Southeast (Figure 6.9). The upper bound for projected changes is very roughly 10 days greater than the weighted multimodel mean. Consistent with widespread warming, there are 20–30 fewer days per year with a minimum temperature below freezing in the northern and eastern parts of the nation, with decreases of more than 40–50 days in much the West. The upper bound for projected changes in freezing events is very roughly 10–20 days fewer than the weighted multimodel mean in many areas.
References
- Abatzoglou, J. T., and K. T. Redmond, 2007: Asymmetry between trends in spring and autumn temperature and circulation regimes over western North America. Geophysical Research Letters, 34, L18808, doi:10.1029/2007GL030891. ↩
- Angélil, O., D. Stone, M. Wehner, C. J. Paciorek, H. Krishnan, and W. Collins, 2017: An independent assessment of anthropogenic attribution statements for recent extreme temperature and rainfall events. Journal of Climate, 30, 5–16, doi:10.1175/JCLI-D-16-0077.1. ↩
- Bindoff, N. L., P. A. Stott, K. M. AchutaRao, M. R. Allen, N. Gillett, D. Gutzler, K. Hansingo, G. Hegerl, Y. Hu, S. Jain, I. I. Mokhov, J. Overland, J. Perlwitz, R. Sebbari, and X. Zhang, 2013: Detection and attribution of climate change: From global to regional. T.F. Stocker, D. Qin, G.-K. Plattner, M. Tignor, S.K. Allen, J. Boschung, A. Nauels, Y. Xia, V. Bex, and P.M. Midgley, Eds., Cambridge University Press, 867–952. URL ↩
- Bonfils, C., P. B. Duffy, B. D. Santer, T. M. L. Wigley, D. B. Lobell, T. J. Phillips, and C. Doutriaux, 2008: Identification of external influences on temperatures in California. Climatic Change, 87, 43–55, doi:10.1007/s10584-007-9374-9. ↩
- Cattiaux, J., and P. Yiou, 2013: U.S. heat waves of spring and summer 2012 from the flow analogue perspective [in “Explaining Extreme Events of 2012 from a Climate Perspective”]. Bulletin of the American Meteorological Society, 94 (9), S10–S13, doi:10.1175/BAMS-D-13-00085.1. ↩
- Christidis, N., P. A. Stott, F. W. Zwiers, H. Shiogama, and T. Nozawa, 2010: Probabilistic estimates of recent changes in temperature: A multi-scale attribution analysis. Climate Dynamics, 34, 1139–1156, doi:10.1007/s00382-009-0615-7. ↩
- Collins, M., R. Knutti, J. Arblaster, J.-L. Dufresne, T. Fichefet, P. Friedlingstein, X. Gao, W. J. Gutowski, T. Johns, G. Krinner, M. Shongwe, C. Tebaldi, A. J. Weaver, and M. Wehner, 2013: Long-term climate change: Projections, commitments and irreversibility. T.F. Stocker, D. Qin, G.-K. Plattner, M. Tignor, S.K. Allen, J. Boschung, A. Nauels, Y. Xia, V. Bex, and P.M. Midgley, Eds., Cambridge University Press, 1029–1136. URL ↩
- Diffenbaugh, N. S., and M. Scherer, 2013: Likelihood of July 2012 U.S. temperatures in pre-industrial and current forcing regimes [in “Explaining Extreme Events of 2013 from a Climate Perspective”]. Bulletin of the American Meteorological Society, 94 (9), S6–S9, doi:10.1175/BAMS-D-13-00085.1. ↩
- Dole, R., M. Hoerling, A. Kumar, J. Eischeid, J. Perlwitz, X.-W. Quan, G. Kiladis, R. Webb, D. Murray, M. Chen, K. Wolter, and T. Zhang, 2014: The making of an extreme event: Putting the pieces together. Bulletin of the American Meteorological Society, 95, 427–440, doi:10.1175/BAMS-D-12-00069.1. ↩
- Donat, M. G., A. D. King, J. T. Overpeck, L. V. Alexander, I. Durre, and D. J. Karoly, 2016: Extraordinary heat during the 1930s US Dust Bowl and associated large-scale conditions. Climate Dynamics, 46, 413–426, doi:10.1007/s00382-015-2590-5. ↩
- Fischer, E. M., U. Beyerle, and R. Knutti, 2013: Robust spatially aggregated projections of climate extremes. Nature Climate Change, 3, 1033–1038, doi:10.1038/nclimate2051. ↩
- Goldstein, A. H., C. D. Koven, C. L. Heald, and I. Y. Fung, 2009: Biogenic carbon and anthropogenic pollutants combine to form a cooling haze over the southeastern United States. Proceedings of the National Academy of Sciences, 106, 8835–8840, doi:10.1073/pnas.0904128106. ↩
- Hoerling, M., M. Chen, R. Dole, J. Eischeid, A. Kumar, J. W. Nielsen-Gammon, P. Pegion, J. Perlwitz, X.-W. Quan, and T. Zhang, 2013: Anatomy of an extreme event. Journal of Climate, 26, 2811–2832, doi:10.1175/JCLI-D-12-00270.1. ↩
- Huang, B., V. F. Banzon, E. Freeman, J. Lawrimore, W. Liu, T. C. Peterson, T. M. Smith, P. W. Thorne, S. D. Woodruff, and H.-M. Zhang, 2015: Extended Reconstructed Sea Surface Temperature Version 4 (ERSST.v4). Part I: Upgrades and intercomparisons. Journal of Climate, 28, 911–930, doi:10.1175/JCLI-D-14-00006.1. ↩
- Jeon, S., C. J. Paciorek, and M. F. Wehner, 2016: Quantile-based bias correction and uncertainty quantification of extreme event attribution statements. Weather and Climate Extremes, 12, 24–32, doi:10.1016/j.wace.2016.02.001. ↩
- Knutson, T. R., F. Zeng, and A. T. Wittenberg, 2013: Multimodel assessment of regional surface temperature trends: CMIP3 and CMIP5 twentieth-century simulations. Journal of Climate, 26, 8709–8743, doi:10.1175/JCLI-D-12-00567.1. ↩
- Knutson, T. R., F. Zeng, and A. T. Wittenberg, 2013: The extreme March-May 2012 warm anomaly over the eastern United States: Global context and multimodel trend analysis [in “Explaining Extreme Events of 2012 from a Climate Perspective”]. Bulletin of the American Meteorological Society, 94 (9), S13–S17, doi:10.1175/BAMS-D-13-00085.1. ↩
- Leibensperger, E. M., L. J. Mickley, D. J. Jacob, W. T. Chen, J. H. Seinfeld, A. Nenes, P. J. Adams, D. G. Streets, N. Kumar, and D. Rind, 2012: Climatic effects of 1950-2050 changes in US anthropogenic aerosols - Part 1: Aerosol trends and radiative forcing. Atmospheric Chemistry and Physics , 12, 3333–3348, doi:10.5194/acp-12-3333-2012. ↩
- Leibensperger, E. M., L. J. Mickley, D. J. Jacob, W. T. Chen, J. H. Seinfeld, A. Nenes, P. J. Adams, D. G. Streets, N. Kumar, and D. Rind, 2012: Climatic effects of 1950–2050 changes in US anthropogenic aerosols – Part 2: Climate response. Atmospheric Chemistry and Physics, 12, 3349–3362, doi:10.5194/acp-12-3349-2012. ↩
- Mascioli, N. R., M. Previdi, A. M. Fiore, and M. Ting, 2017: Timing and seasonality of the United States “warming hole.” Environmental Research Letters, 12, 034008, doi:10.1088/1748-9326/aa5ef4. ↩
- Mazdiyasni, O., and A. AghaKouchak, 2015: Substantial increase in concurrent droughts and heatwaves in the United States. Proceedings of the National Academy of Sciences, 112, 11484–11489, doi:10.1073/pnas.1422945112. ↩
- Mears, C. A., and F. J. Wentz, 2016: Sensitivity of satellite-derived tropospheric temperature trends to the diurnal cycle adjustment. Journal of Climate, 29, 3629–3646, doi:10.1175/JCLI-D-15-0744.1. ↩
- Meehl, G. A., C. Tebaldi, and D. Adams-Smith, 2016: US daily temperature records past, present, and future. Proceedings of the National Academy of Sciences, 113, 13977–13982, doi:10.1073/pnas.1606117113. ↩
- Meehl, G. A., J. M. Arblaster, and G. Branstator, 2012: Mechanisms contributing to the warming hole and the consequent US east-west differential of heat extremes. Journal of Climate, 25, 6394–6408, doi:10.1175/JCLI-D-11-00655.1. ↩
- Menne, M. J., I. Durre, R. S. Vose, B. E. Gleason, and T. G. Houston, 2012: An overview of the global historical climatology network-daily database. Journal of Atmospheric and Oceanic Technology, 29, 897–910, doi:10.1175/JTECH-D-11-00103.1. ↩
- Min, S.-K., X. Zhang, F. Zwiers, H. Shiogama, Y.-S. Tung, and M. Wehner, 2013: Multimodel detection and attribution of extreme temperature changes. Journal of Climate, 26, 7430–7451, doi:10.1175/JCLI-D-12-00551.1. ↩
- Mueller, N. D., E. E. Butler, K. A. McKinnon, A. Rhines, M. Tingley, N. M. Holbrook, and P. Huybers, 2016: Cooling of US Midwest summer temperature extremes from cropland intensification. Nature Climate Change, 6, 317–322, doi:10.1038/nclimate2825. ↩
- PAGES 2K Consortium, 2013: Continental-scale temperature variability during the past two millennia. Nature Geoscience, 6, 339–346, doi:10.1038/ngeo1797. ↩
- Pan, Z., X. Liu, S. Kumar, Z. Gao, and J. Kinter, 2013: Intermodel variability and mechanism attribution of central and southeastern U.S. anomalous cooling in the twentieth century as simulated by CMIP5 models. Journal of Climate, 26, 6215–6237, doi:10.1175/JCLI-D-12-00559.1. ↩
- Peterson, T. C. et al., 2013: Monitoring and understanding changes in heat waves, cold waves, floods and droughts in the United States: State of knowledge. Bulletin of the American Meteorological Society, 94, 821–834, doi:10.1175/BAMS-D-12-00066.1. ↩
- Pierce, D. W., D. R. Cayan, and B. L. Thrasher, 2014: Statistical downscaling using Localized Constructed Analogs (LOCA). Journal of Hydrometeorology, 15, 2558–2585, doi:10.1175/jhm-d-14-0082.1. ↩
- Pierce, D. W., T. P. Barnett, B. D. Santer, and P. J. Gleckler, 2009: Selecting global climate models for regional climate change studies. Proceedings of the National Academy of Sciences, 106, 8441–8446, doi:10.1073/pnas.0900094106. ↩
- Po-Chedley, S., T. J. Thorsen, and Q. Fu, 2015: Removing diurnal cycle contamination in satellite-derived tropospheric temperatures: Understanding tropical tropospheric trend discrepancies. Journal of Climate, 28, 2274–2290, doi:10.1175/JCLI-D-13-00767.1. ↩
- Rupp, D. E., P. W. Mote, N. Massey, C. J. Rye, R. Jones, and M. R. Allen, 2012: Did human influence on climate make the 2011 Texas drought more probable? [in “Explaining Extreme Events of 2011 from a Climate Perspective”]. Bulletin of the American Meteorological Society, 93, 1052–1054, doi:10.1175/BAMS-D-12-00021.1. ↩
- Russo, S., A. Dosio, R. G. Graversen, J. Sillmann, H. Carrao, M. B. Dunbar, A. Singleton, P. Montagna, P. Barbola, and J. V. Vogt, 2014: Magnitude of extreme heat waves in present climate and their projection in a warming world. Journal of Geophysical Research Atmospheres, 119, 12,500–512,512, doi:10.1002/2014JD022098. ↩
- Seager, R., M. Hoerling, D. S. Siegfried, hailan Wang, B. Lyon, A. Kumar, J. Nakamura, and N. Henderson, 2014: Causes and Predictability of the 2011-14 California Drought. 40 pp., National Oceanic and Atmospheric Administration, Drought Task Force Narrative Team. ↩
- Sillmann, J., V. V. Kharin, F. W. Zwiers, X. Zhang, and D. Bronaugh, 2013: Climate extremes indices in the CMIP5 multimodel ensemble: Part 2. Future climate projections. Journal of Geophysical Research: Atmospheres, 118, 2473–2493, doi:10.1002/jgrd.50188. ↩
- Smith, T. T., B. F. Zaitchik, and J. M. Gohlke, 2013: Heat waves in the United States: Definitions, patterns and trends. Climatic Change, 118, 811–825, doi:10.1007/s10584-012-0659-2. ↩
- Spencer, R. W., J. R. Christy, and W. D. Braswell, 2017: UAH Version 6 global satellite temperature products: Methodology and results. Asia-Pacific Journal of Atmospheric Sciences, 53, 121–130, doi:10.1007/s13143-017-0010-y. ↩
- Sun, L., K. E. Kunkel, L. E. Stevens, A. Buddenberg, J. G. Dobson, and D. R. Easterling, 2015: Regional Surface Climate Conditions in CMIP3 and CMIP5 for the United States: Differences, Similarities, and Implications for the U.S. National Climate Assessment. 111 pp., National Oceanic and Atmospheric Administration, National Environmental Satellite, Data, and Information Service. ↩
- Thorne, P. W., M. G. Donat, R. J. H. Dunn, C. N. Williams, L. V. Alexander, J. Caesar, I. Durre, I. Harris, Z. Hausfather, P. D. Jones, M. J. Menne, R. Rohde, R. S. Vose, R. Davy, A. M. G. Klein-Tank, J. H. Lawrimore, T. C. Peterson, and J. J. Rennie, 2016: Reassessing changes in diurnal temperature range: Intercomparison and evaluation of existing global data set estimates. Journal of Geophysical Research Atmospheres, 121, 5138–5158, doi:10.1002/2015JD024584. ↩
- Trenary, L., T. DelSole, B. Doty, and M. K. Tippett, 2015: Was the cold eastern US Winter of 2014 due to increased variability? Bulletin of the American Meteorological Society, 96 (12), S15–S19, doi:10.1175/bams-d-15-00138.1. ↩
- Trouet, V., H. F. Diaz, E. R. Wahl, A. E. Viau, R. Graham, N. Graham, and E. R. Cook, 2013: A 1500-year reconstruction of annual mean temperature for temperate North America on decadal-to-multidecadal time scales. Environmental Research Letters, 8, 024008, doi:10.1088/1748-9326/8/2/024008. ↩
- Vose, R. S., D. Arndt, V. F. Banzon, D. R. Easterling, B. Gleason, B. Huang, E. Kearns, J. H. Lawrimore, M. J. Menne, T. C. Peterson, R. W. Reynolds, T. M. Smith, C. N. Williams, and D. L. Wuertz, 2012: NOAA’s Merged Land-Ocean Surface Temperature Analysis. Bulletin of the American Meteorological Society, 93, 1677–1685, doi:10.1175/BAMS-D-11-00241.1. ↩
- Vose, R. S., M. Squires, D. Arndt, I. Durre, C. Fenimore, K. Gleason, M. J. Menne, J. Partain, C. N. Williams Jr., P. A. Bieniek, and R. L. Thoman, 2017: Deriving historical temperature and precipitation time series for Alaska climate divisions via climatologically aided interpolation. Journal of Service Climatology , 10, 20. URL ↩
- Vose, R. S., S. Applequist, M. Squires, I. Durre, M. J. Menne, C. N. Williams, C. Fenimore, K. Gleason, and D. Arndt, 2014: Improved Historical Temperature and Precipitation Time Series for U.S. Climate Divisions. Journal of Applied Meteorology and Climatology, 53, 1232–1251, doi:10.1175/JAMC-D-13-0248.1. ↩
- Wahl, E. R., and J. E. Smerdon, 2012: Comparative performance of paleoclimate field and index reconstructions derived from climate proxies and noise-only predictors. Geophysical Research Letters, 39, L06703, doi:10.1029/2012GL051086. ↩
- Walsh, J. et al., 2014: Ch. 2: Our Changing Climate. J.M. Melillo, T. (T. C.. Richmond, and G.W. Yohe, Eds., U.S. Global Change Research Program, 19–67. ↩
- Wolter, K., J. K. Eischeid, X.-W. Quan, T. N. Chase, M. Hoerling, R. M. Dole, G. J. V. Oldenborgh, and J. E. Walsh, 2015: How unusual was the cold winter of 2013/14 in the Upper Midwest? [in “Explaining Extreme Events of 2014 from a Climate Perspective”]. Bulletin of the American Meteorological Society, 96 (12), S10–S14, doi:10.1175/bams-d-15-00126.1. ↩
- Wuebbles, D. J., G. Meehl, K. Hayhoe, T. R. Karl, K. Kunkel, B. Santer, M. Wehner, B. Colle, E. M. Fischer, R. Fu, A. Goodman, E. Janssen, H. Lee, W. Li, L. N. Long, S. Olsen, A. J. Sheffield, and L. Sun, 2014: CMIP5 climate model analyses: Climate extremes in the United States. Bulletin of the American Meteorological Society, 95, 571–583, doi:10.1175/BAMS-D-12-00172.1. ↩
- Xu, L. et al., 2015: Effects of anthropogenic emissions on aerosol formation from isoprene and monoterpenes in the southeastern United States. Proceedings of the National Academy of Sciences, 112, 37–42, doi:10.1073/pnas.1417609112. ↩
- Yu, S., K. Alapaty, R. Mathur, J. Pleim, Y. Zhang, C. Nolte, B. Eder, K. Foley, and T. Nagashima, 2014: Attribution of the United States “warming hole”: Aerosol indirect effect and precipitable water vapor. Scientific Reports, 4, 6929, doi:10.1038/srep06929. ↩
- Zhang, X., L. Alexander, G. C. Hegerl, P. Jones, A. K. Tank, T. C. Peterson, B. Trewin, and F. W. Zwiers, 2011: Indices for monitoring changes in extremes based on daily temperature and precipitation data. Wiley Interdisciplinary Reviews: Climate Change, 2, 851–870, doi:10.1002/wcc.147. ↩
- Zou, C.-Z., and J. Li, 2014: NOAA MSU Mean Layer Temperature. 35 pp., National Oceanic and Atmospheric Administration, Center for Satellite Applications and Research. URL ↩
- Zwiers, F. W., X. B. Zhang, and Y. Feng, 2011: Anthropogenic influence on long return period daily temperature extremes at regional scales. Journal of Climate, 24, 881–892, doi:10.1175/2010jcli3908.1. ↩