1.1: Introduction
Since the Third U.S. National Climate Assessment (NCA3) was published in May 2014, new observations along multiple lines of evidence have strengthened the conclusion that Earth’s climate is changing at a pace and in a pattern not explainable by natural influences. While this report focuses especially on observed and projected future changes for the United States, it is important to understand those changes in the global context (this chapter).
The world has warmed over the last 150 years, especially over the last six decades, and that warming has triggered many other changes to Earth’s climate. Evidence for a changing climate abounds, from the top of the atmosphere to the depths of the oceans. Thousands of studies conducted by tens of thousands of scientists around the world have documented changes in surface, atmospheric, and oceanic temperatures; melting glaciers; disappearing snow cover; shrinking sea ice; rising sea level; and an increase in atmospheric water vapor. Rainfall patterns and storms are changing, and the occurrence of droughts is shifting.
Many lines of evidence demonstrate that human activities, especially emissions of greenhouse gases, are primarily responsible for the observed climate changes in the industrial era, especially over the last six decades (see attribution analysis in Ch. 3: Detection and Attribution). Formal detection and attribution studies for the period 1951 to 2010 find that the observed global mean surface temperature warming lies in the middle of the range of likely human contributions to warming over that same period. The Intergovernmental Panel on Climate Change concluded that it is extremely likely that human influence has been the dominant cause of the observed warming since the mid-20th century.1 Over the last century, there are no alternative explanations supported by the evidence that are either credible or that can contribute more than marginally to the observed patterns. There is no convincing evidence that natural variability can account for the amount of and the pattern of global warming observed over the industrial era.2 ,3 ,4 ,5 Solar flux variations over the last six decades have been too small to explain the observed changes in climate.6 ,7 ,8 There are no apparent natural cycles in the observational record that can explain the recent changes in climate (e.g., PAGES 2k Consortium 2013;9 Marcott et al. 2013;10 Otto-Bliesner et al. 201611 ). In addition, natural cycles within Earth’s climate system can only redistribute heat; they cannot be responsible for the observed increase in the overall heat content of the climate system.12 Any explanations for the observed changes in climate must be grounded in understood physical mechanisms, appropriate in scale, and consistent in timing and direction with the long-term observed trends. Known human activities quite reasonably explain what has happened without the need for other factors. Internal variability and forcing factors other than human activities cannot explain what is happening, and there are no suggested factors, even speculative ones, that can explain the timing or magnitude and that would somehow cancel out the role of human factors.3 ,13 The science underlying this evidence, along with the observed and projected changes in climate, is discussed in later chapters, starting with the basis for a human influence on climate in Chapter 2: Physical Drivers of Climate Change.
Throughout this report, we also analyze projections of future changes in climate. As discussed in Chapter 4, beyond the next few decades, the magnitude of climate change depends primarily on cumulative emissions of greenhouse gases and aerosols and the sensitivity of the climate system to those emissions. Predicting how climate will change in future decades is a different scientific issue from predicting weather a few weeks from now. Local weather is short term, with limited predictability, and is determined by the complicated movement and interaction of high pressure and low pressure systems in the atmosphere; thus, it is difficult to forecast day-to-day changes beyond about two weeks into the future. Climate, on the other hand, is the statistics of weather—meaning not just average values but also the prevalence and intensity of extremes—as observed over a period of decades. Climate emerges from the interaction, over time, of rapidly changing local weather and more slowly changing regional and global influences, such as the distribution of heat in the oceans, the amount of energy reaching Earth from the sun, and the composition of the atmosphere. See Chapter 4: Projections and later chapters for more on climate projections.
Throughout this report, we include many findings that further strengthen or add to the understanding of climate change relative to those found in NCA3 and other assessments of the science. Several of these are highlighted in an “Advances Since NCA3” box at the end of this chapter.
1.2: Indicators of a Globally Changing Climate
Highly diverse types of direct measurements made on land, sea, and in the atmosphere over many decades have allowed scientists to conclude with high confidence that global mean temperature is increasing. Observational datasets for many other climate variables support the conclusion with high confidence that the global climate is changing (also see EPA 201614 ).15 ,16 Figure 1.1 depicts several of the observational indicators that demonstrate trends consistent with a warming planet over the last century. Temperatures in the lower atmosphere and ocean have increased, as have near-surface humidity and sea level. Not only has ocean heat content increased dramatically (Figure 1.1), but more than 90% of the energy gained in the combined ocean–atmosphere system over recent decades has gone into the ocean.17 ,18 Five different observational datasets show the heat content of the oceans is increasing.
Basic physics tells us that a warmer atmosphere can hold more water vapor; this is exactly what is measured from satellite data. At the same time, a warmer world means higher evaporation rates and major changes to the hydrological cycle (e.g., Kundzewicz 2008;19 IPCC 20131 ), including increases in the prevalence of torrential downpours. In addition, arctic sea ice, mountain glaciers, and Northern Hemisphere spring snow cover have all decreased. The relatively small increase in Antarctic sea ice in the 15-year period from 2000 through early 2016 appears to be best explained as being due to localized natural variability (see e.g., Meehl et al. 2016a;16 Ramsayer 201420 ); while possibly also related to natural variability, the 2017 Antarctic sea ice minimum reached in early March was the lowest measured since reliable records began in 1979. The vast majority of the glaciers in the world are losing mass at significant rates. The two largest ice sheets on our planet—on the land masses of Greenland and Antarctica—are shrinking.
Many other indicators of the changing climate have been determined from other observations—for example, changes in the growing season and the allergy season (see e.g., EPA 2016;14 USGCRP 201721 ). In general, the indicators demonstrate continuing changes in climate since the publication of NCA3. As with temperature, independent researchers have analyzed each of these indicators and come to the same conclusion: all of these changes paint a consistent and compelling picture of a warming planet.
Figure 1.1
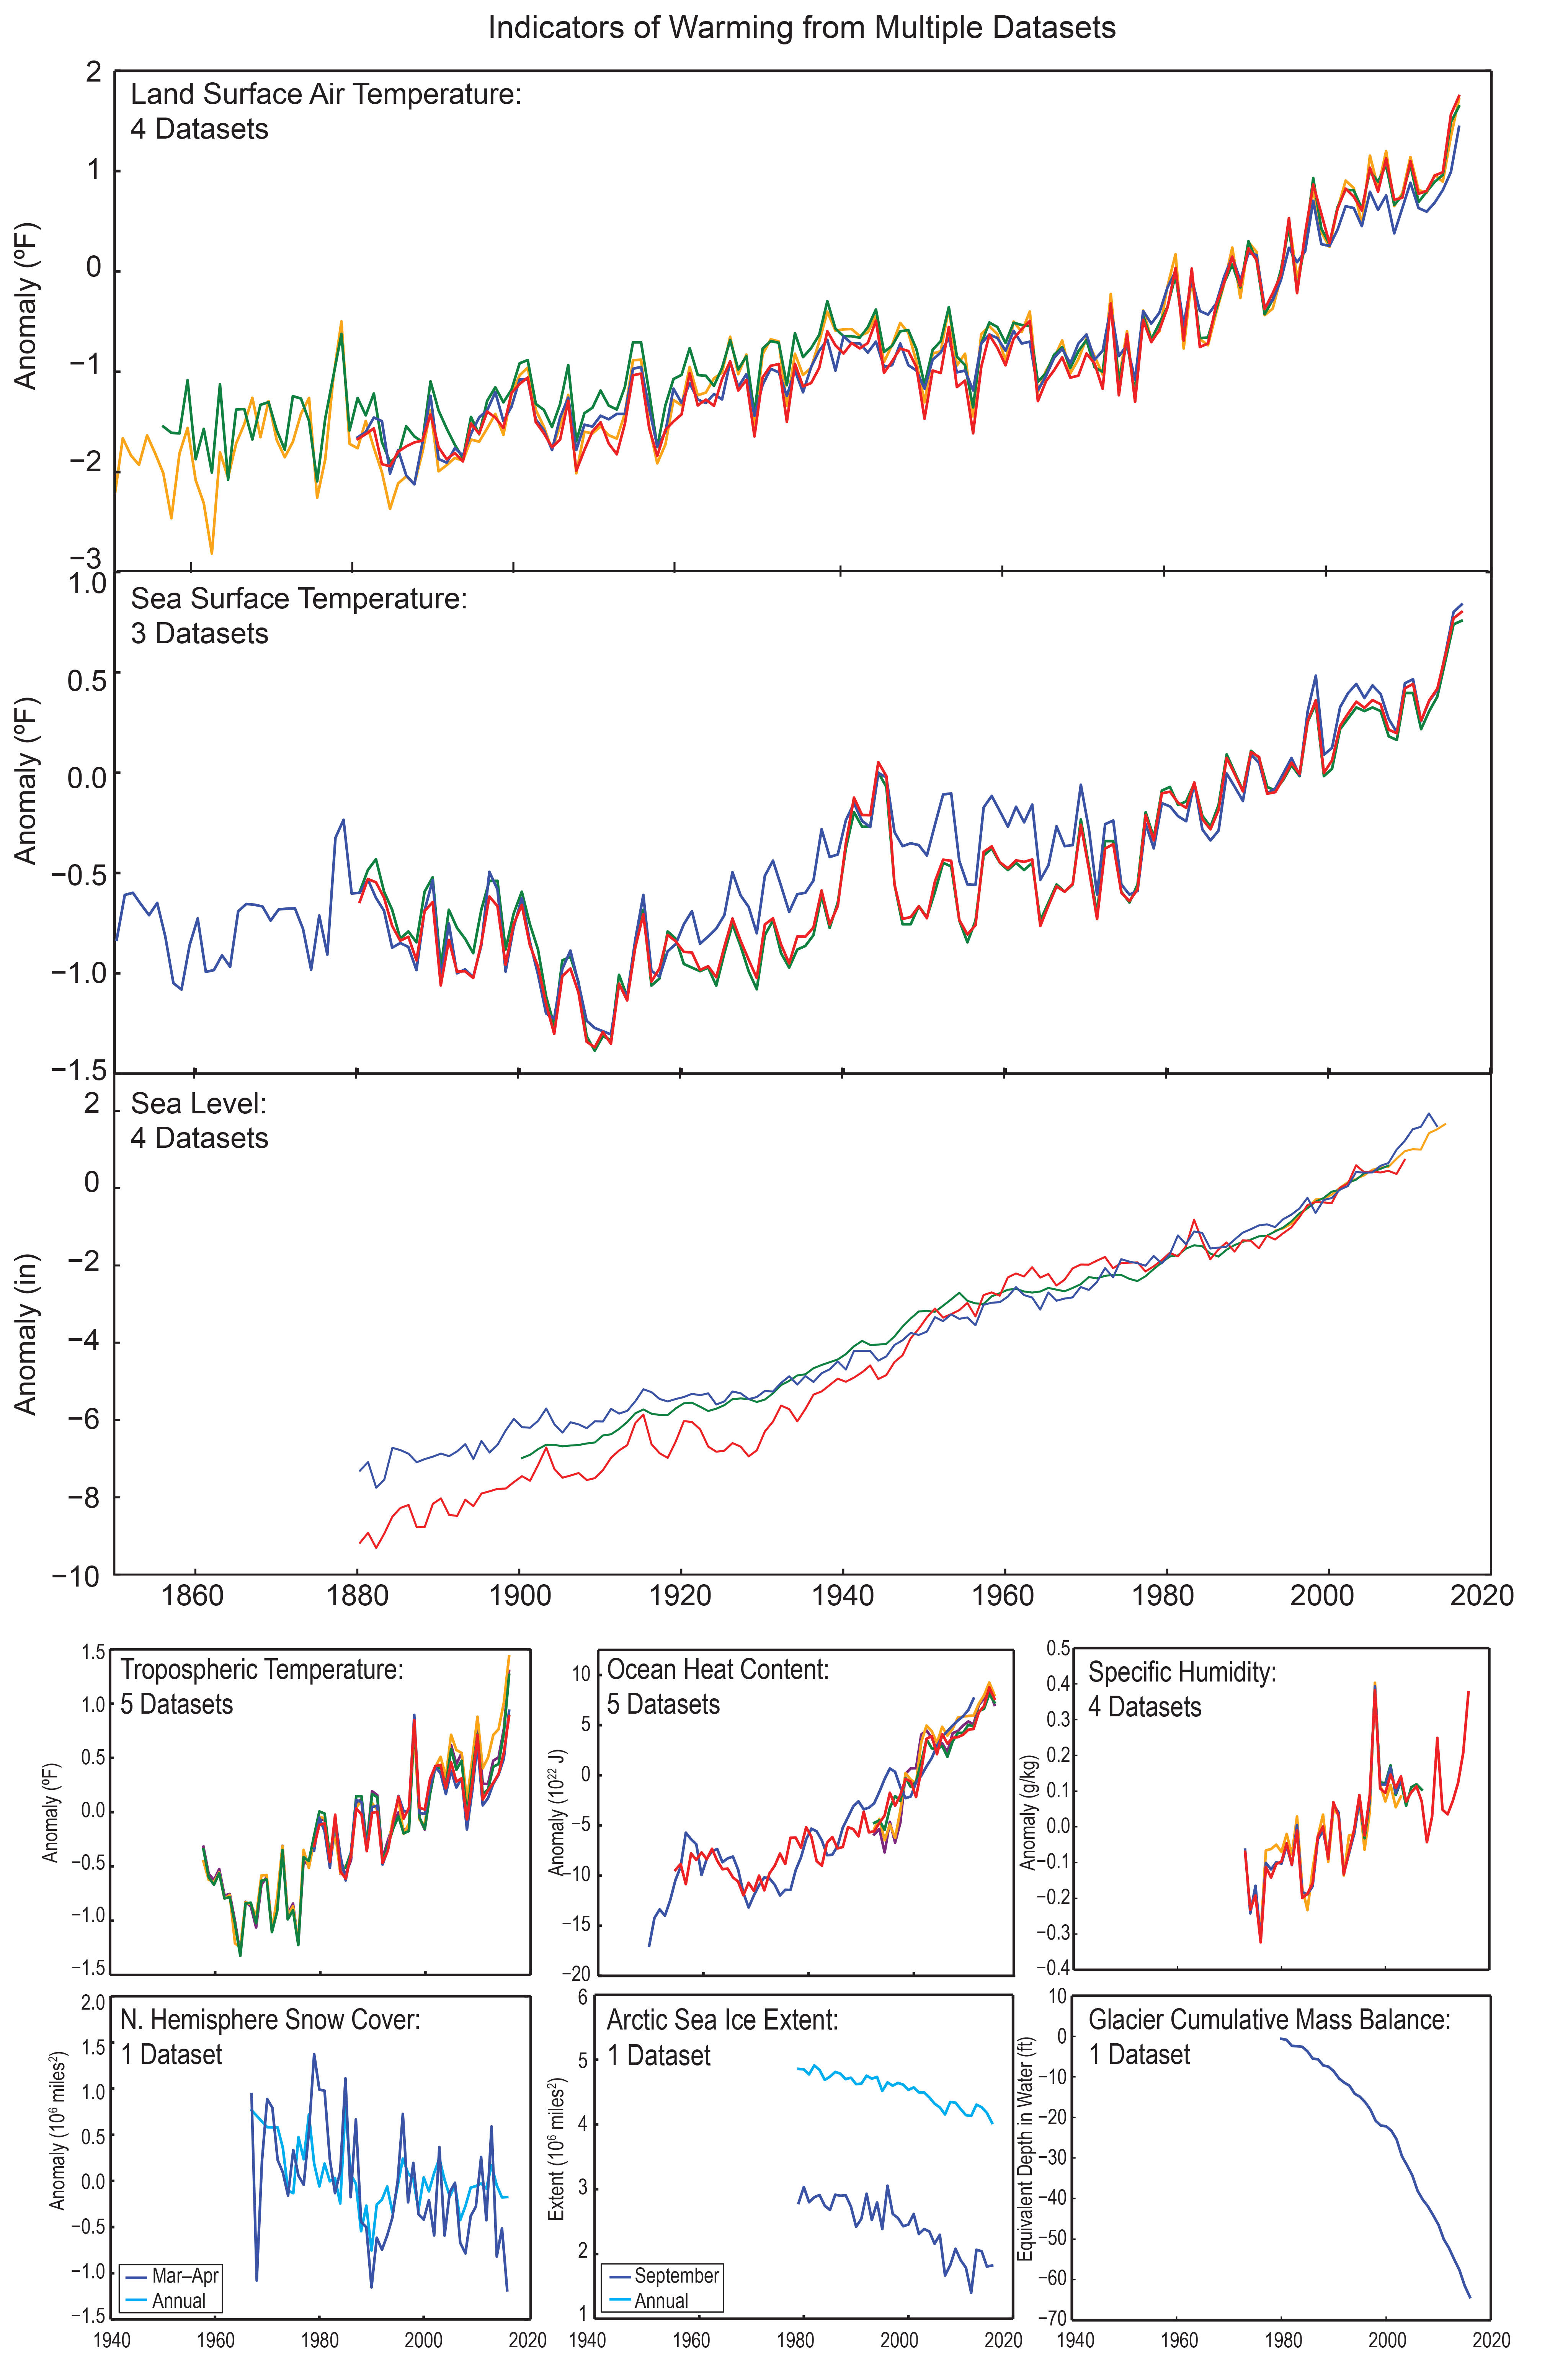
This image shows observations globally from nine different variables that are key indicators of a warming climate. The indicators (listed below) all show long-term trends that are consistent with global warming. In parentheses are the number of datasets shown in each graph, the length of time covered by the combined datasets and their anomaly reference period (where applicable), and the direction of the trend: land surface air temperature (4 datasets, 1850–2016 relative to 1976–2005, increase); sea surface temperature (3 datasets, 1850–2016 relative to 1976–2005, increase); sea level (4 datasets, 1880–2014 relative to 1996–2005, increase); tropospheric temperature (5 datasets, 1958–2016 relative to 1981–2005, increase); ocean heat content, upper 700m (5 datasets, 1950–2016 relative to 1996–2005, increase); specific humidity (4 datasets, 1973–2016 relative to 1980–2003, increase); Northern Hemisphere snow cover, March–April and annual (1 dataset, 1967–2016 relative to 1976–2005, decrease); arctic sea ice extent, September and annual (1 dataset, 1979–2016, decrease); glacier cumulative mass balance (1 dataset, 1980–2016, decrease). More information on the datasets can be found in the accompanying metadata. (Figure source: NOAA NCEI and CICS-NC, updated from Melillo et al. 2014;144 Blunden and Arndt 201615 ).
1.3: Trends in Global Temperatures
Global annual average temperature (as calculated from instrumental records over both land and oceans; used interchangeably with global average temperature in the discussion below) has increased by more than 1.2°F (0.7°C) for the period 1986–2016 relative to 1901–1960 (Figure 1.2); see Vose et al.22 for discussion on how global annual average temperature is derived by scientists. The linear regression change over the entire period from 1901–2016 is 1.8°F (1.0°C). Global average temperature is not expected to increase smoothly over time in response to the human warming influences, because the warming trend is superimposed on natural variability associated with, for example, the El Niño/La Niña ocean-heat oscillations and the cooling effects of particles emitted by volcanic eruptions. Even so, 16 of the 17 warmest years in the instrumental record (since the late 1800s) occurred in the period from 2001 to 2016 (1998 was the exception). Global average temperature for 2016 has now surpassed 2015 by a small amount as the warmest year on record. The year 2015 far surpassed 2014 by 0.29°F (0.16°C), four times greater than the difference between 2014 and the next warmest year, 2010.23 Three of the four warmest years on record have occurred since the analyses through 2012 were reported in NCA3.
A strong El Niño contributed to 2015’s record warmth.15 Though an even more powerful El Niño occurred in 1998, the global temperature in that year was significantly lower (by 0.49°F [0.27°C]) than that in 2015. This suggests that human-induced warming now has a stronger influence on the occurrence of record temperatures than El Niño events. In addition, the El Niño/La Niña cycle may itself be affected by the human influence on Earth’s climate system.3 ,24 It is the complex interaction of natural sources of variability with the continuously growing human warming influence that is now shaping Earth’s weather and, as a result, its climate.
Globally, the persistence of the warming over the past 60 years far exceeds what can be accounted for by natural variability alone.1 That does not mean, of course, that natural sources of variability have become insignificant. They can be expected to continue to contribute a degree of “bumpiness” in the year-to-year global average temperature trajectory, as well as exert influences on the average rate of warming that can last a decade or more (see Box 1.1).25 ,26 ,27
Figure 1.2
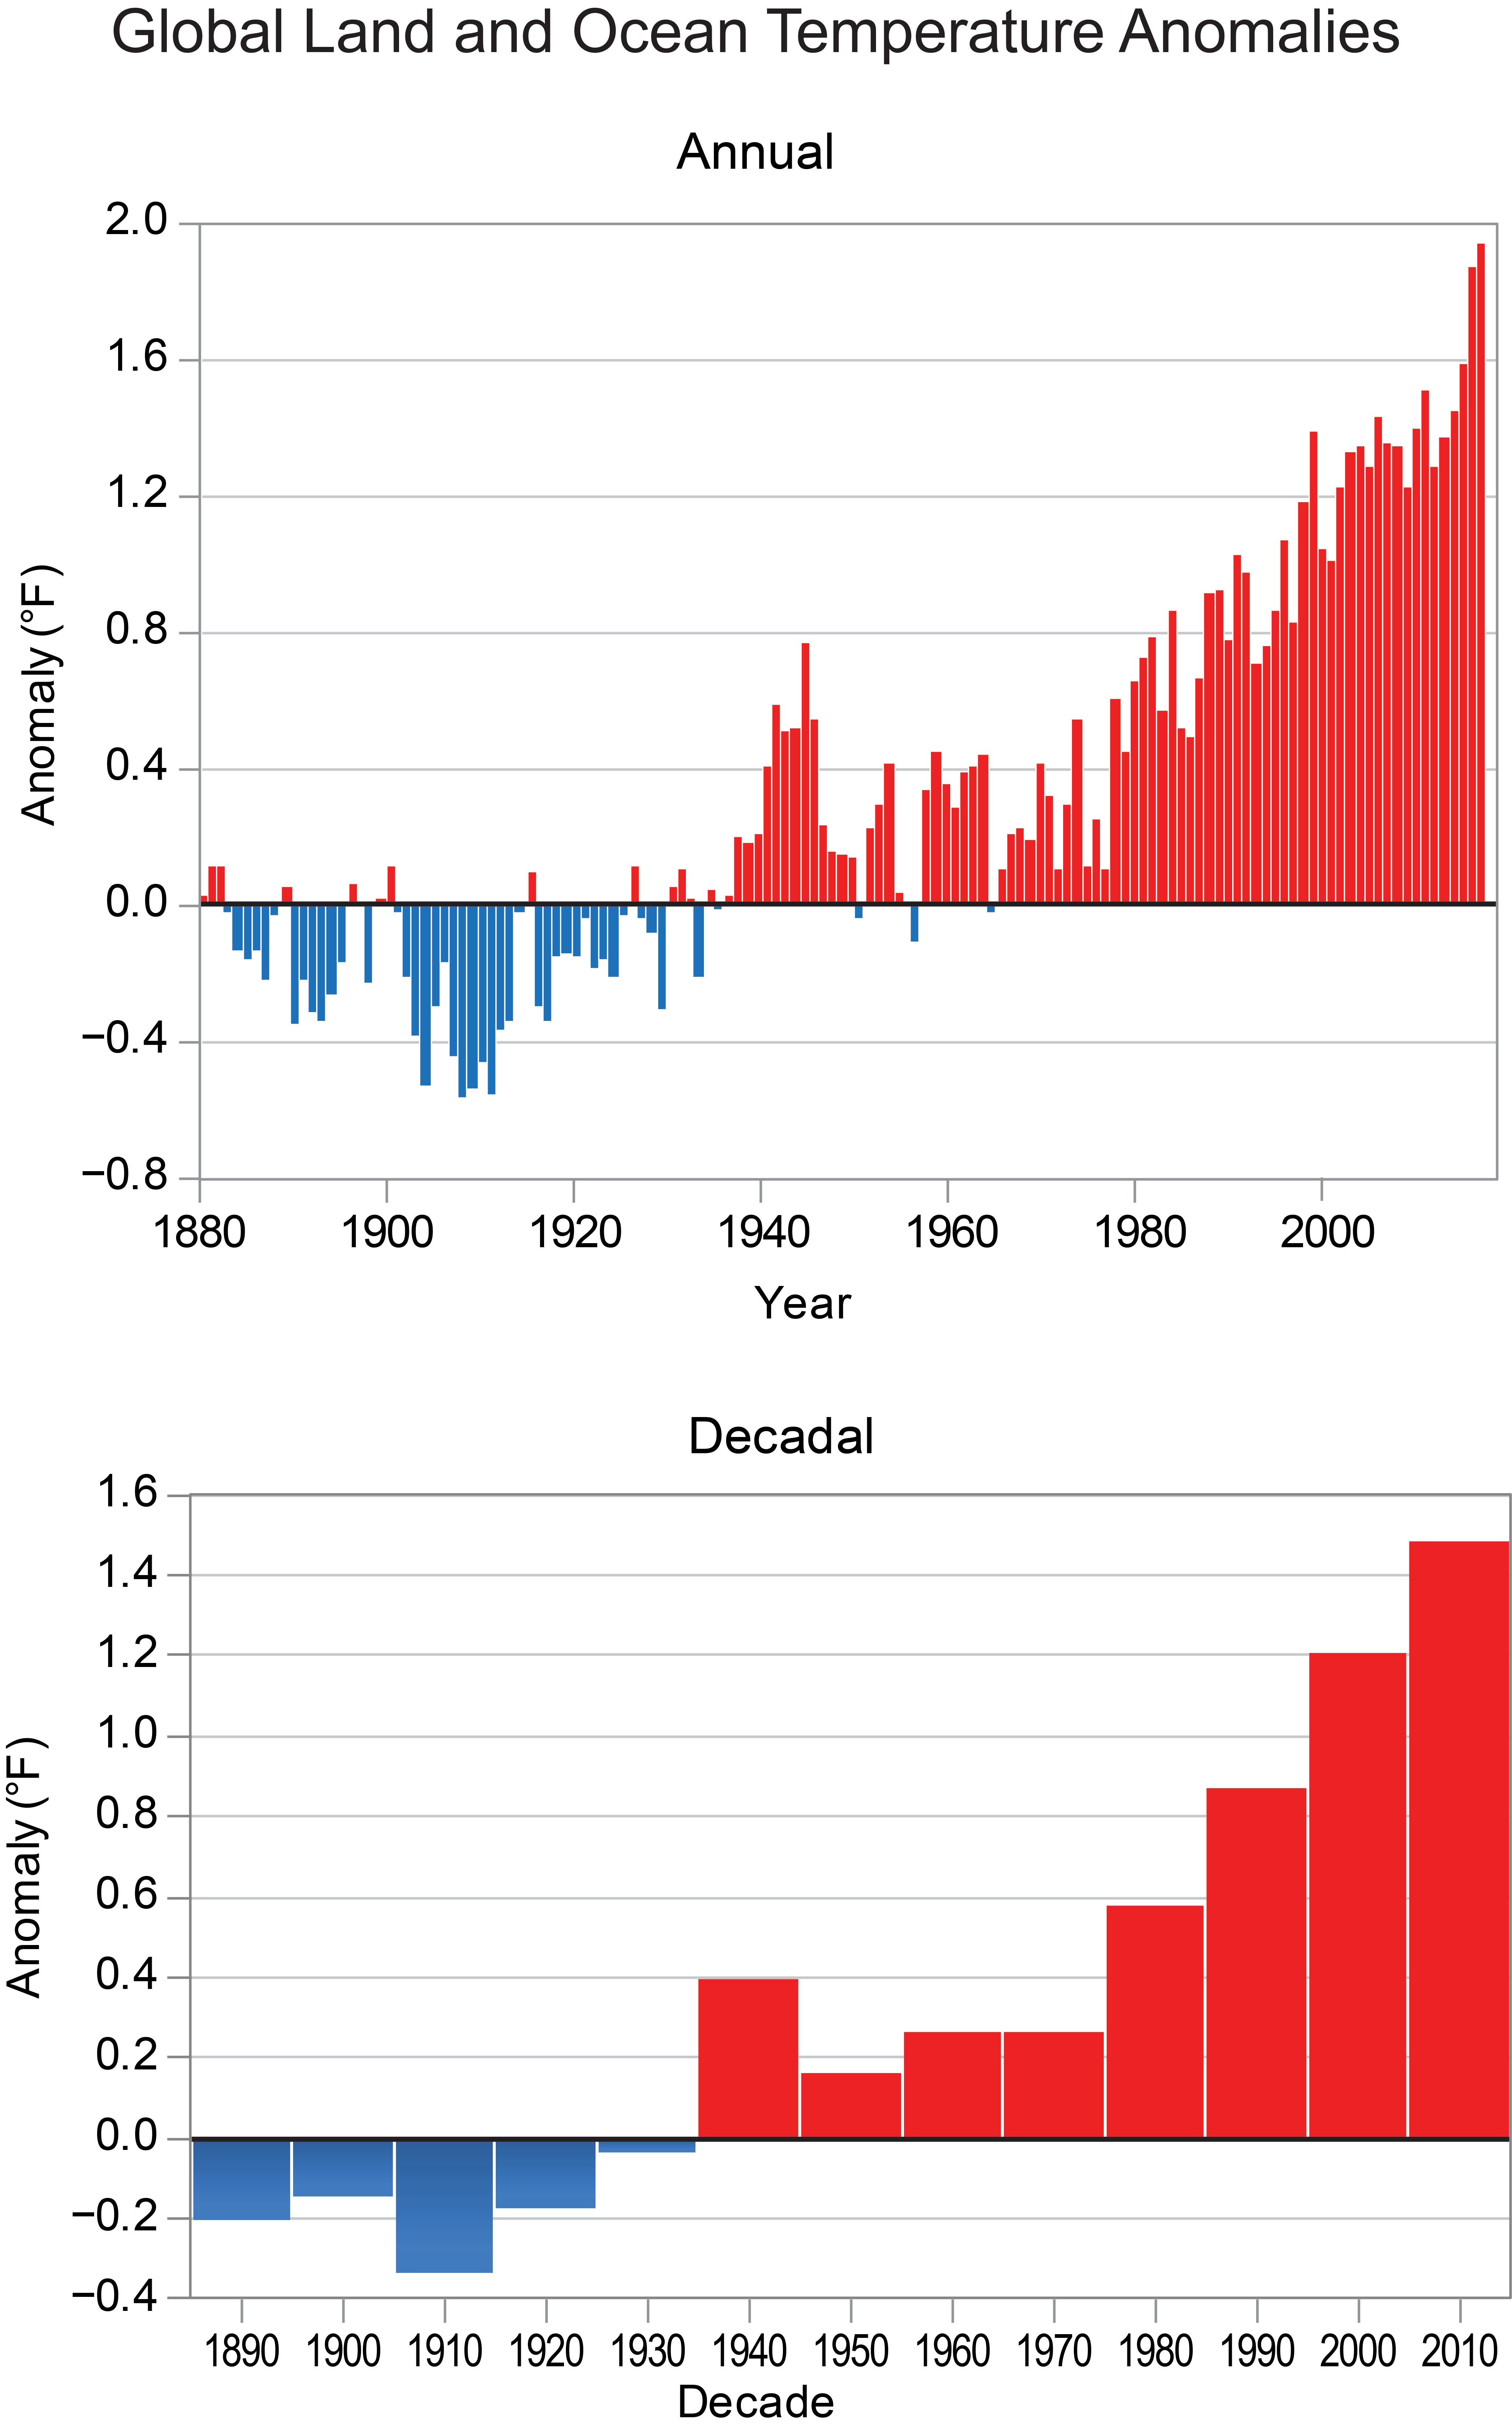
Top: Global annual average temperatures (as measured over both land and oceans) for 1880–2016 relative to the reference period of 1901–1960; red bars indicate temperatures above the average over 1901–1960, and blue bars indicate temperatures below the average. Global annual average temperature has increased by more than 1.2°F (0.7°C) for the period 1986–2016 relative to 1901–1960. While there is a clear long-term global warming trend, some years do not show a temperature increase relative to the previous year, and some years show greater changes than others. These year-to-year fluctuations in temperature are mainly due to natural sources of variability, such as the effects of El Niños, La Niñas, and volcanic eruptions. Based on the NCEI (NOAAGlobalTemp) dataset (updated from Vose et al.22 ) Bottom: Global average temperature averaged over decadal periods (1886–1895, 1896–1905, …, 1996–2005, except for the 11 years in the last period, 2006–2016). Horizontal label indicates midpoint year of decadal period. Every decade since 1966–1975 has been warmer than the previous decade. (Figure source: [top] adapted from NCEI 2016,23 [bottom] NOAA NCEI and CICS-NC).
Warming during the first half of the 1900s occurred mostly in the Northern Hemisphere.28 Recent decades have seen greater warming in response to accelerating increases in greenhouse gas concentrations, particularly at high northern latitudes, and over land as compared to the ocean (see Figure 1.3). In general, winter is warming faster than summer (especially in northern latitudes). Also, nights are warming faster than days.29 ,30 There is also some evidence of faster warming at higher elevations.31
Most ocean areas around Earth are warming (see Ch. 13: Ocean Changes). Even in the absence of significant ice melt, the ocean is expected to warm more slowly given its larger heat capacity, leading to land–ocean differences in warming (as seen in Figure 1.3). As a result, the climate for land areas often responds more rapidly than the ocean areas, even though the forcing driving a change in climate occurs equally over land and the oceans.1 A few regions, such as the North Atlantic Ocean, have experienced cooling over the last century, though these areas have warmed over recent decades. Regional climate variability is important to determining potential effects of climate change on the ocean circulation (e.g., Hurrell and Deser 2009;32 Hoegh-Guldberg et al. 201433 ) as are the effects of the increasing freshwater in the North Atlantic from melting of sea and land ice.34
Figure 1.3
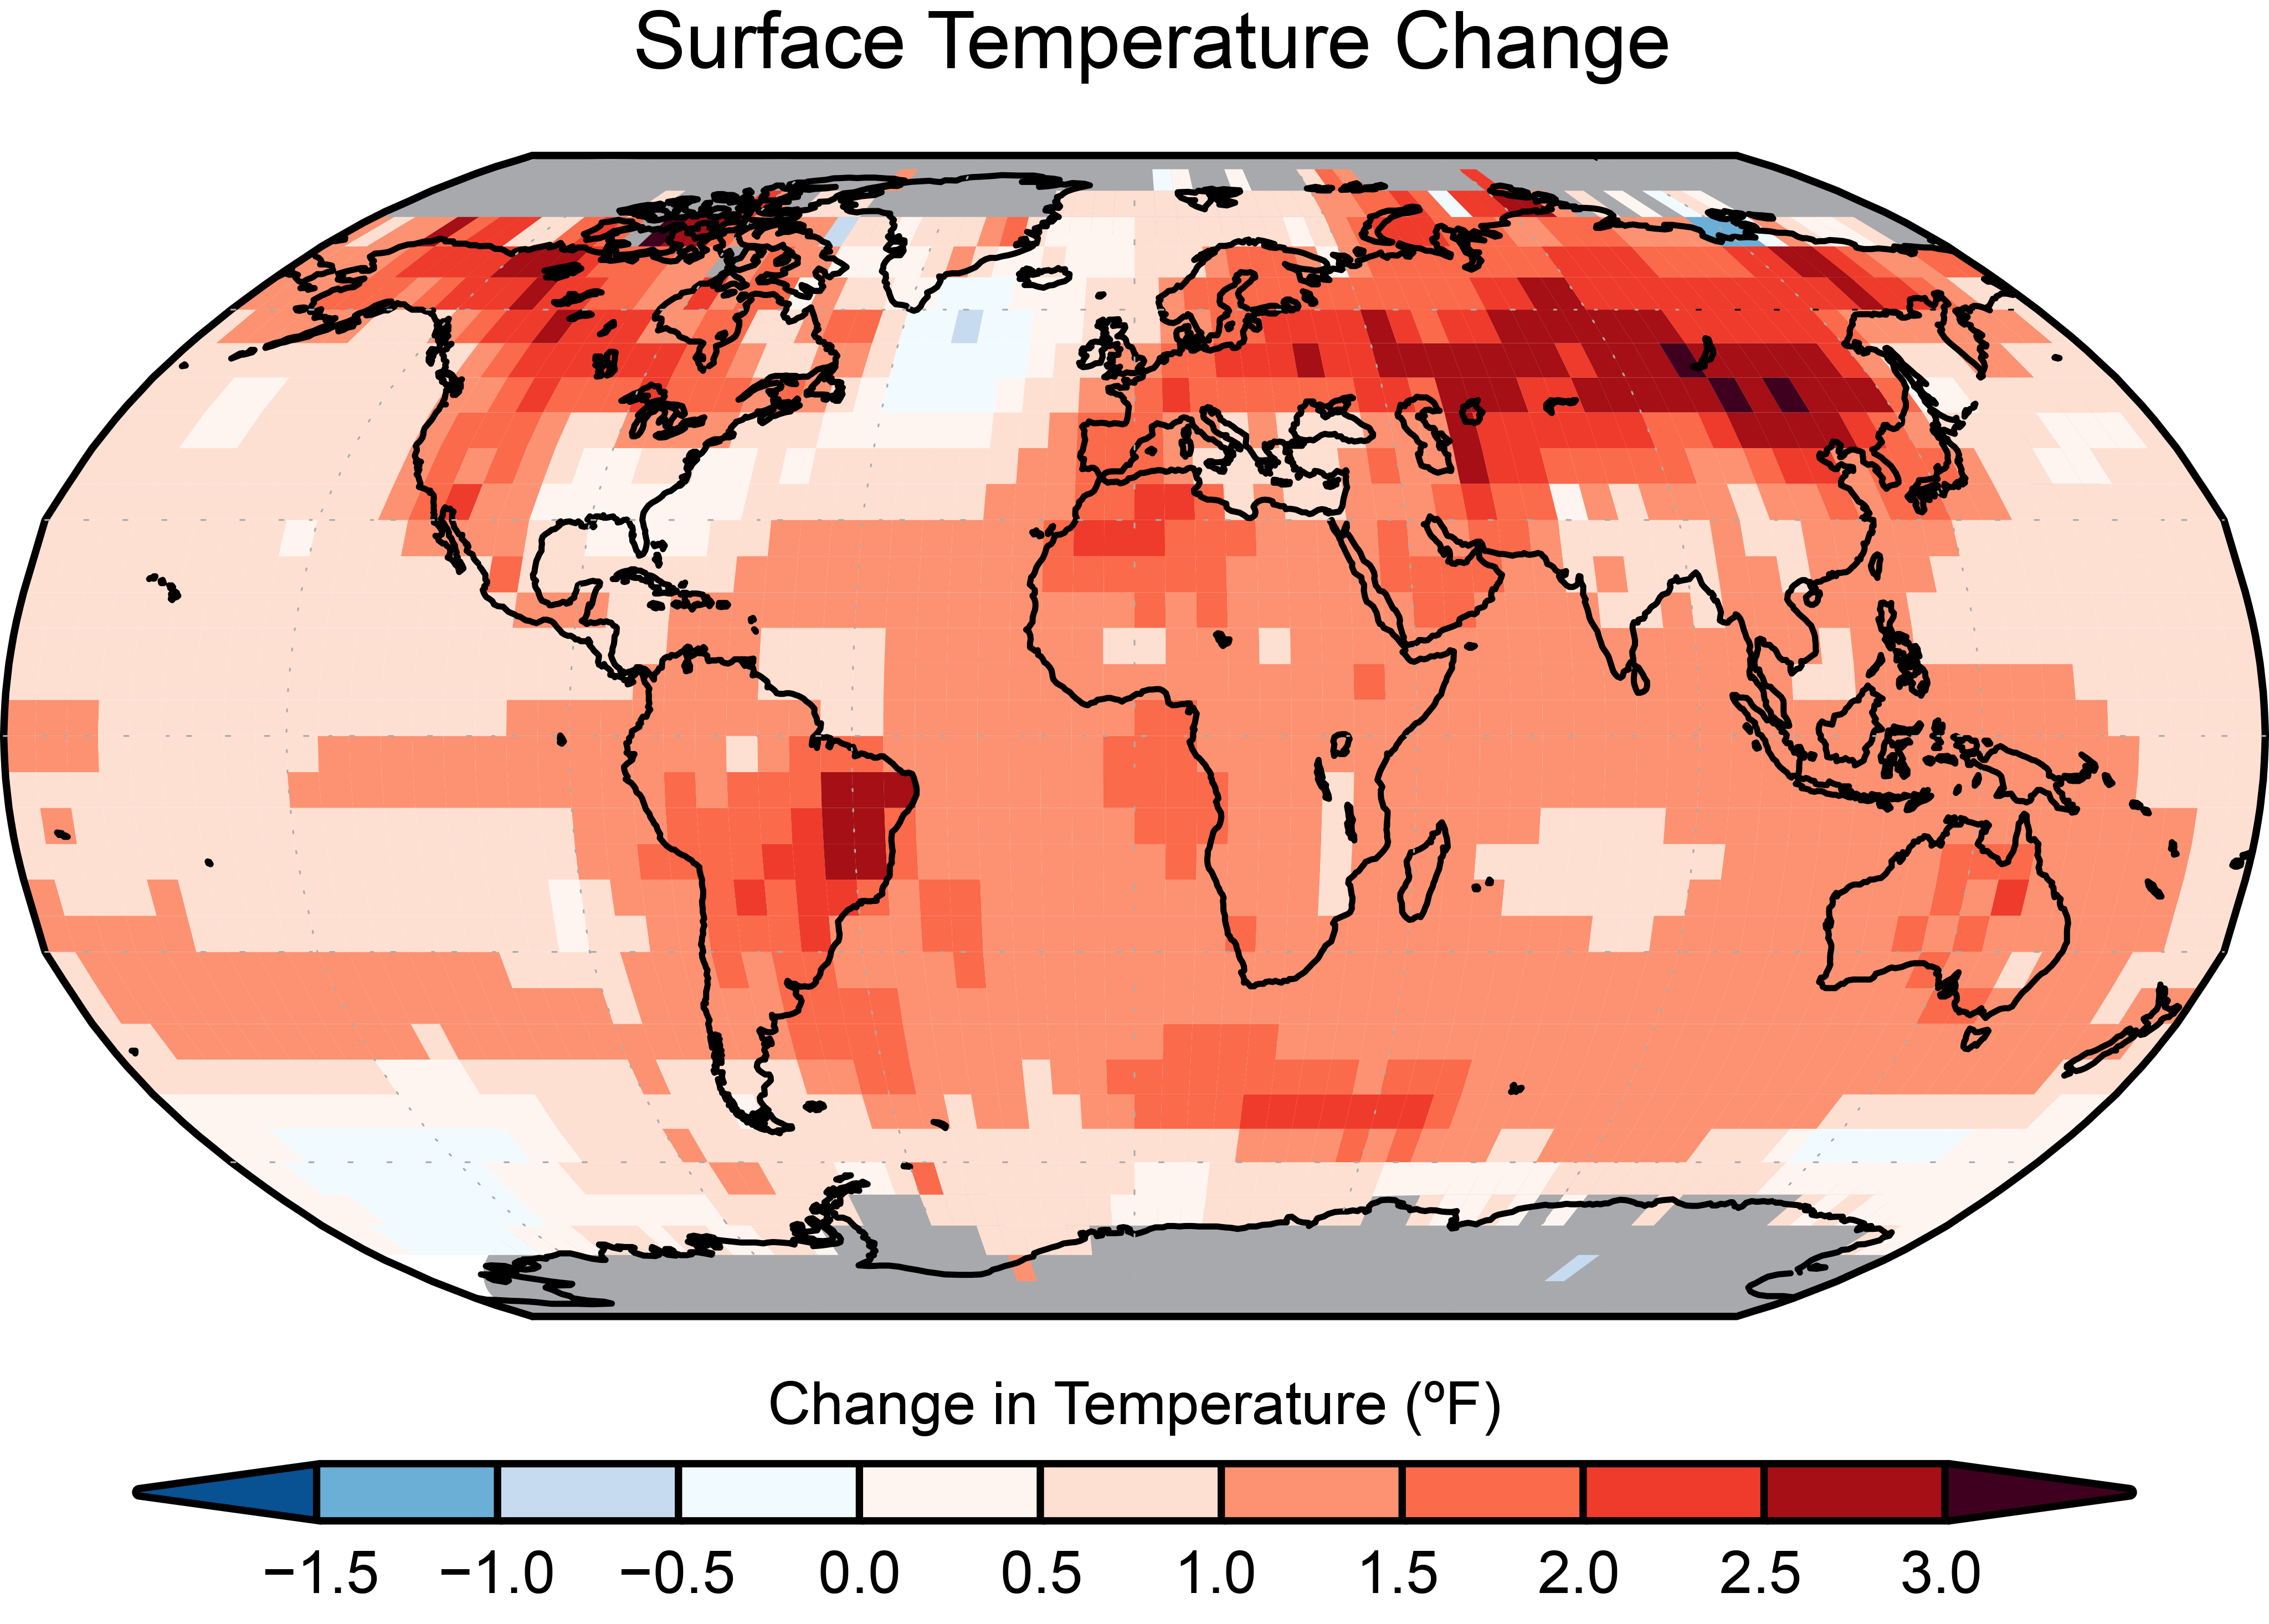
Surface temperature change (in °F) for the period 1986–2015 relative to 1901–1960 from the NOAA National Centers for Environmental Information’s (NCEI) surface temperature product. For visual clarity, statistical significance is not depicted on this map. Changes are generally significant (at the 90% level) over most land and ocean areas. Changes are not significant in parts of the North Atlantic Ocean, the South Pacific Ocean, and the southeastern United States. There is insufficient data in the Arctic Ocean and Antarctica for computing long-term changes (those sections are shown in gray because no trend can be derived). The relatively coarse resolution (5.0° × 5.0°) of these maps does not capture the finer details associated with mountains, coastlines, and other small-scale effects (see Ch. 6: Temperature Changes for a focus on the United States). (Figure source: updated from Vose et al. 201222 ).
Figure 1.4

Multimodel simulated time series from 1900 to 2100 for the change in global annual mean surface temperature relative to 1901–1960 for a range of the Representative Concentration Pathways (RCPs; see Ch. 4: Projections for more information). These scenarios account for the uncertainty in future emissions from human activities (as analyzed with the 20+ models from around the world used in the most recent international assessment1 ). The mean (solid lines) and associated uncertainties (shading, showing ±2 standard deviations [5%–95%] across the distribution of individual models based on the average over 2081–2100) are given for all of the RCP scenarios as colored vertical bars. The numbers of models used to calculate the multimodel means are indicated. (Figure source: adapted from Walsh et al. 2014201 ).
Figure 1.4 shows the projected changes in globally averaged temperature for a range of future pathways that vary from assuming strong continued dependence on fossil fuels in energy and transportation systems over the 21st century (the high scenario is Representative Concentration Pathway 8.5, or RCP8.5) to assuming major emissions reduction (the even lower scenario, RCP2.6). Chapter 4: Projections describes the future scenarios and the models of Earth’s climate system being used to quantify the impact of human choices and natural variability on future climate. These analyses also suggest that global surface temperature increases for the end of the 21st century are very likely to exceed 1.5°C (2.7°F) relative to the 1850–1900 average for all projections, with the exception of the lowest part of the uncertainty range for RCP2.6.1 ,35 ,36 ,37
1.4: Trends in Global Precipitation
Annual averaged precipitation across global land areas exhibits a slight rise (that is not statistically significant because of a lack of data coverage early in the record) over the past century (see Figure 1.7) along with ongoing increases in atmospheric moisture levels. Interannual and interdecadal variability is clearly found in all precipitation evaluations, owing to factors such as the North Atlantic Oscillation (NAO) and ENSO—note that precipitation reconstructions are updated operationally by NOAA NCEI on a monthly basis.57 ,58
Figure 1.7
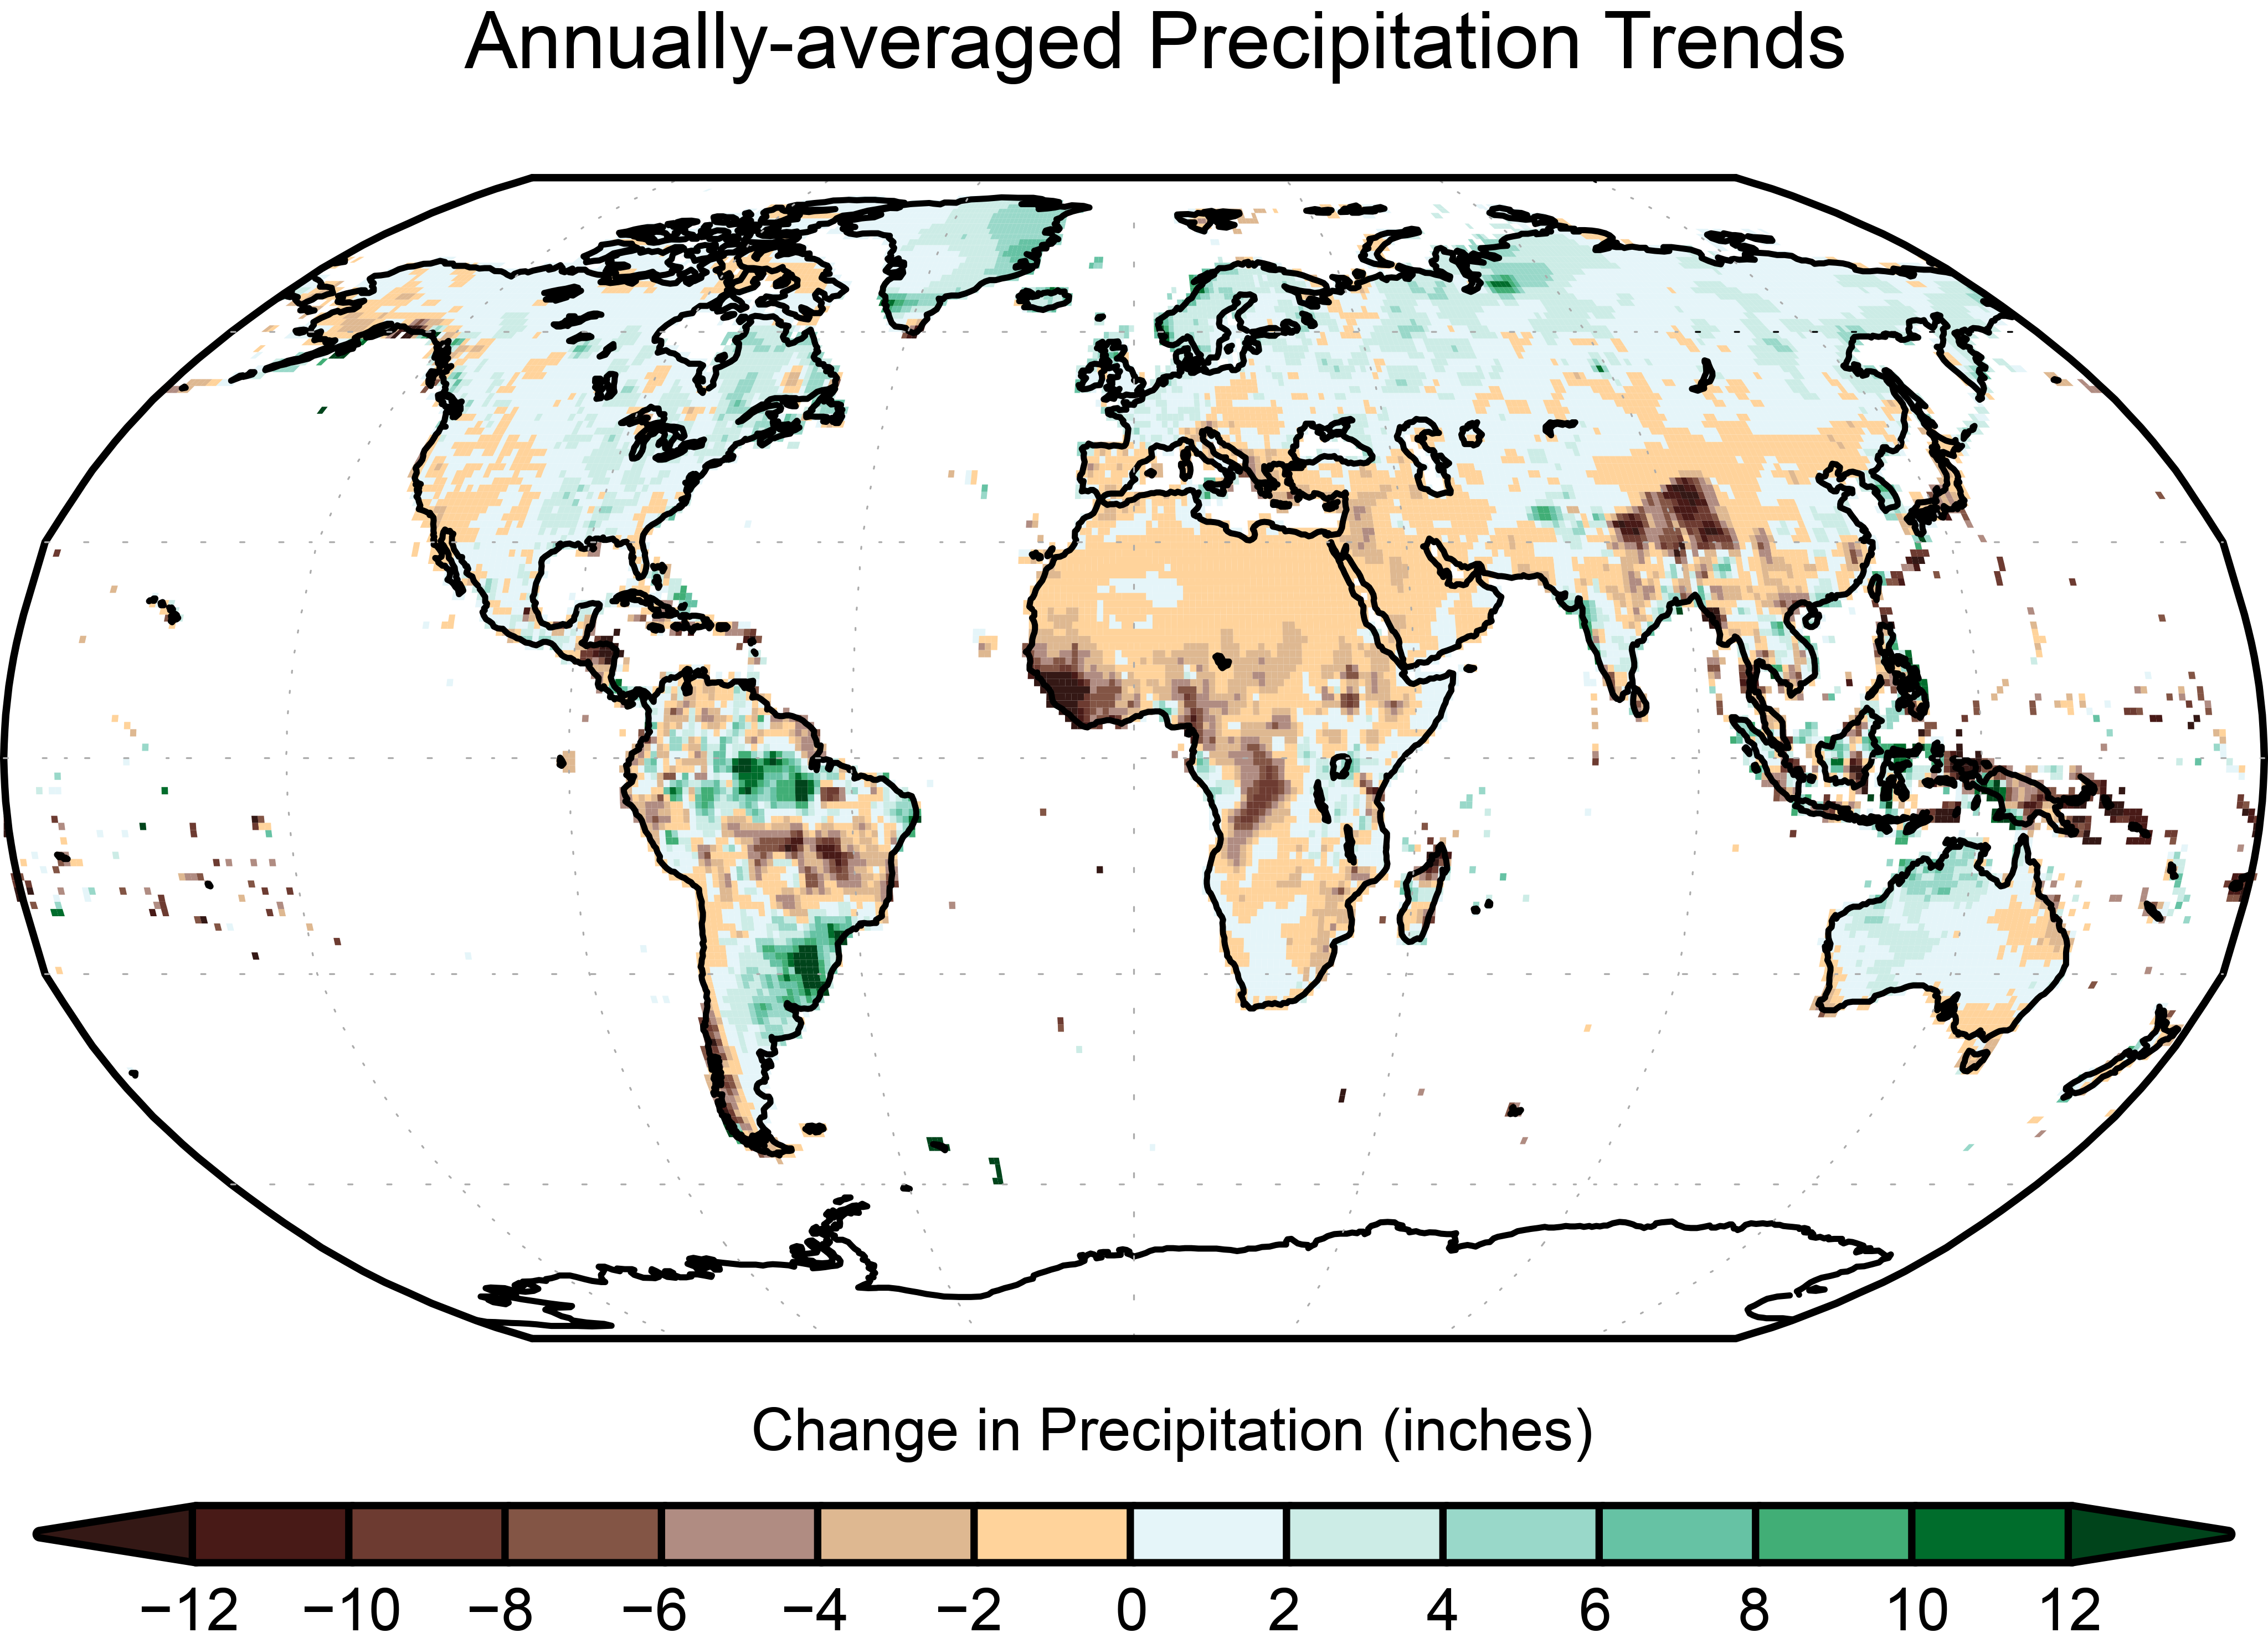
Surface annually averaged precipitation change (in inches) for the period 1986–2015 relative to 1901–1960. The data is from long-term stations, so precipitation changes over the ocean and Antarctica cannot be evaluated. The trends are not considered to be statistically significant because of a lack of data coverage early in the record. The relatively coarse resolution (0.5° × 0.5°) of these maps does not capture the finer details associated with mountains, coastlines, and other small-scale effects. (Figure source: NOAA NCEI and CICS-NC).
The hydrological cycle and the amount of global mean precipitation is primarily controlled by the atmosphere’s energy budget and its interactions with clouds.59 The amount of global mean precipitation also changes as a result of a mix of fast and slow atmospheric responses to the changing climate.60 In the long term, increases in tropospheric radiative effects from increasing amounts of atmospheric CO2 (i.e., increasing CO2 leads to greater energy absorbed by the atmosphere and re-emitted to the surface, with the additional transport to the atmosphere coming by convection) must be balanced by increased latent heating, resulting in precipitation increases of approximately 0.55% to 0.72% per °F (1% to 3% per °C).1 ,61 Global atmospheric water vapor should increase by about 6%–7% per °C of warming based on the Clausius–Clapeyron relationship (see Ch. 2: Physical Drivers of Climate Change); satellite observations of changes in precipitable water over oceans have been detected at about this rate and attributed to human-caused changes in the atmosphere.62 Similar observed changes in land-based measurements have also been attributed to the changes in climate from greenhouse gases.63
Earlier studies suggested a climate change pattern of wet areas getting wetter and dry areas getting drier (e.g., Greve et al. 201464 ). While Hadley Cell expansion should lead to more drying in the subtropics, the poleward shift of storm tracks should lead to enhanced wet regions. While this high/low rainfall behavior appears to be valid over ocean areas, changes over land are more complicated. The wet versus dry pattern in observed precipitation has only been attributed for the zonal mean65 ,66 and not regionally due to the large amount of spatial variation in precipitation changes as well as significant natural variability. The detected signal in zonal mean precipitation is largest in the Northern Hemisphere, with decreases in the subtropics and increases at high latitudes. As a result, the observed increase (about 5% since the 1950s67 ,68 ) in annual averaged arctic precipitation have been detected and attributed to human activities.69
1.5: Trends in Global Extreme Weather Events
A change in the frequency, duration, and/or magnitude of extreme weather events is one of the most important consequences of a warming climate. In statistical terms, a small shift in the mean of a weather variable, with or without this shift occurring in concert with a change in the shape of its probability distribution, can cause a large change in the probability of a value relative to an extreme threshold (see Figure 1.8 in IPCC 20131 ).70 Examples include extreme high temperature events and heavy precipitation events. Some of the other extreme events, such as intense tropical cyclones, midlatitude cyclones, lightning, and hail and tornadoes associated with thunderstorms can occur as more isolated events and generally have more limited temporal and spatial observational datasets, making it more difficult to study their long-term trends. Detecting trends in the frequency and intensity of extreme weather events is challenging.71 The most intense events are rare by definition, and observations may be incomplete and suffer from reporting biases. Further discussion on trends and projections of extreme events for the United States can be found in Chapters 6–9 and 11.
An emerging area in the science of detection and attribution has been the attribution of extreme weather and climate events. Extreme event attribution generally addresses the question of whether climate change has altered the odds of occurrence of an extreme event like one just experienced. Attribution of extreme weather events under a changing climate is now an important and highly visible aspect of climate science. As discussed in a recent National Academy of Sciences (NAS) report,72 the science of event attribution is rapidly advancing, including the understanding of the mechanisms that produce extreme events and the development of methods that are used for event attribution. Several other reports and papers have reviewed the topic of extreme event attribution.73 ,74 ,75 This report briefly reviews extreme event attribution methodologies in practice (Ch. 3: Detection and Attribution) and provides a number of examples within the chapters on various climate phenomena (especially relating to the United States in Chapters 6–9).
Extreme Heat and Cold
The frequency of multiday heat waves and extreme high temperatures at both daytime and nighttime hours is increasing over many of the global land areas.1 There are increasing areas of land throughout our planet experiencing an excess number of daily highs above given thresholds (for example, the 90th percentile), with an approximate doubling of the world’s land area since 1998 with 30 extreme heat days per year.76 At the same time, frequencies of cold waves and extremely low temperatures are decreasing over the United States and much of the earth. In the United States, the number of record daily high temperatures has been about double the number of record daily low temperatures in the 2000s,77 and much of the United States has experienced decreases of 5%–20% per decade in cold wave frequency.1 ,75
The enhanced radiative forcing caused by greenhouse gases has a direct influence on heat extremes by shifting distributions of daily temperature.78 Recent work indicates changes in atmospheric circulation may also play a significant role (see Ch. 5: Circulation and Variability). For example, a recent study found that increasing anticyclonic circulations partially explain observed trends in heat events over North America and Eurasia, among other effects.79 Observed changes in circulation may also be the result of human influences on climate, though this is still an area of active research.
Extreme Precipitation
A robust consequence of a warming climate is an increase in atmospheric water vapor, which exacerbates precipitation events under similar meteorological conditions, meaning that when rainfall occurs, the amount of rain falling in that event tends to be greater. As a result, what in the past have been considered to be extreme precipitation events are becoming more frequent.1 ,80 ,81 ,82 On a global scale, the observational annual-maximum daily precipitation has increased by 8.5% over the last 110 years; global climate models also derive an increase in extreme precipitation globally but tend to underestimate the rate of the observed increase.80 ,82 ,83 Extreme precipitation events are increasing in frequency globally over both wet and dry regions.82 Although more spatially heterogeneous than heat extremes, numerous studies have found increases in precipitation extremes on many regions using a variety of methods and threshold definitions,84 and those increases can be attributed to human-caused changes to the atmosphere.85 ,86 Finally, extreme precipitation associated with tropical cyclones (TCs) is expected to increase in the future,87 but current trends are not clear.84
The impact of extreme precipitation trends on flooding globally is complex because additional factors like soil moisture and changes in land cover are important.88 Globally, due to limited data, there is low confidence for any significant current trends in river-flooding associated with climate change,89 but the magnitude and intensity of river flooding is projected to increase in the future.90 More on flooding trends in the United States is in Chapter 8: Droughts, Floods, and Wildfires.
Tornadoes and Thunderstorms
Increasing air temperature and moisture increase the risk of extreme convection, and there is evidence for a global increase in severe thunderstorm conditions.91 Strong convection, along with wind shear, represents favorable conditions for tornadoes. Thus, there is reason to expect increased tornado frequency and intensity in a warming climate.92 Inferring current changes in tornado activity is hampered by changes in reporting standards, and trends remain highly uncertain (see Ch. 9: Extreme Storms).84
Winter Storms
Winter storm tracks have shifted slightly northward (by about 0.4 degrees latitude) in recent decades over the Northern Hemisphere.93 More generally, extratropical cyclone activity is projected to change in complex ways under future climate scenarios, with increases in some regions and seasons and decreases in others. There are large model-to-model differences among CMIP5 climate models, with some models underestimating the current cyclone track density.94 ,95
Enhanced arctic warming (arctic amplification), due in part to sea ice loss, reduces lower tropospheric meridional temperature gradients, diminishing baroclinicity (a measure of how misaligned the gradient of pressure is from the gradient of air density)—an important energy source for extratropical cyclones. At the same time, upper-level meridional temperature gradients will increase due to a warming tropical upper troposphere and a cooling high-latitude lower stratosphere. While these two effects counteract each other with respect to a projected change in midlatitude storm tracks, the simulations indicate that the magnitude of arctic amplification may modulate some aspects (e.g., jet stream position, wave extent, and blocking frequency) of the circulation in the North Atlantic region in some seasons.96
Tropical Cyclones
Detection and attribution of trends in past tropical cyclone (TC) activity is hampered by uncertainties in the data collected prior to the satellite era and by uncertainty in the relative contributions of natural variability and anthropogenic influences. Theoretical arguments and numerical modeling simulations support an expectation that radiative forcing by greenhouse gases and anthropogenic aerosols can affect TC activity in a variety of ways, but robust formal detection and attribution for past observed changes has not yet been realized. Since the IPCC AR5,1 there is new evidence that the locations where tropical cyclones reach their peak intensity have migrated poleward in both the Northern and Southern Hemispheres, in concert with the independently measured expansion of the tropics.97 In the western North Pacific, this migration has substantially changed the tropical cyclone hazard exposure patterns in the region and appears to have occurred outside of the historically measured modes of regional natural variability.98
Whether global trends in high-intensity tropical cyclones are already observable is a topic of active debate. Some research suggests positive trends,99 ,100 but significant uncertainties remain (see Ch. 9: Extreme Storms).100 Other studies have suggested that aerosol pollution has masked the increase in TC intensity expected otherwise from enhanced greenhouse warming.101 ,102
Tropical cyclone intensities are expected to increase with warming, both on average and at the high end of the scale, as the range of achievable intensities expands, so that the most intense storms will exceed the intensity of any in the historical record.102 Some studies have projected an overall increase in tropical cyclone activity.103 However, studies with high-resolution models are giving a different result. For example, a high-resolution dynamical downscaling study of global TC activity under the lower scenario (RCP4.5) projects an increased occurrence of the highest-intensity tropical cyclones (Saffir–Simpson Categories 4 and 5), along with a reduced overall tropical cyclone frequency, though there are considerable basin-to-basin differences.87 Chapter 9: Extreme Storms covers more on extreme storms affecting the United States.
1.6: Global Changes in Land Processes
Changes in regional land cover have had important effects on climate, while climate change also has important effects on land cover (also see Ch. 10: Land Cover).1 In some cases, there are changes in land cover that are both consequences of and influences on global climate change (e.g., declines in land ice and snow cover, thawing permafrost, and insect damage to forests).
Northern Hemisphere snow cover extent has decreased, especially in spring, primarily due to earlier spring snowmelt (by about 0.2 million square miles [0.5 million square km]104 ,105 ), and this decrease since the 1970s is at least partially driven by anthropogenic influences.106 Snow cover reductions, especially in the Arctic region in summer, have led to reduced seasonal albedo.107
While global-scale trends in drought are uncertain due to insufficient observations, regional trends indicate increased frequency and intensity of drought and aridification on land cover in the Mediterranean108 ,109 and West Africa110 ,111 and decreased frequency and intensity of droughts in central North America112 and northwestern Australia.110 ,111 ,113
Anthropogenic land-use changes, such as deforestation and growing cropland extent, have increased the global land surface albedo, resulting in a small cooling effect. Effects of other land-use changes, including modifications of surface roughness, latent heat flux, river runoff, and irrigation, are difficult to quantify, but may offset the direct land-use albedo changes.114 ,115
Globally, land-use change since 1750 has been typified by deforestation, driven by the growth in intensive farming and urban development. Global land-use change is estimated to have released 190 ± 65 GtC (gigatonnes of carbon) through 2015.116 ,117 Over the same period, cumulative fossil fuel and industrial emissions are estimated to have been 410 ± 20 GtC, yielding total anthropogenic emissions of 600 ± 70 GtC, of which cumulative land-use change emissions were about 32%.116 ,117 Tropical deforestation is the dominant driver of land-use change emissions, estimated at 0.1–1.7 GtC per year, primarily from biomass burning. Global deforestation emissions of about 3 GtC per year are compensated by around 2 GtC per year of forest regrowth in some regions, mainly from abandoned agricultural land.118 ,119
Natural terrestrial ecosystems are gaining carbon through uptake of CO2 by enhanced photosynthesis due to higher CO2 levels, increased nitrogen deposition, and longer growing seasons in mid- and high latitudes. Anthropogenic atmospheric CO2 absorbed by land ecosystems is stored as organic matter in live biomass (leaves, stems, and roots), dead biomass (litter and woody debris), and soil carbon.
Many studies have documented a lengthening growing season, primarily due to the changing climate,120 ,121 ,122 ,123 and elevated CO2 is expected to further lengthen the growing season in places where the length is water limited.124 In addition, a recent study has shown an overall increase in greening of Earth in vegetated regions,125 while another has demonstrated evidence that the greening of Northern Hemisphere extratropical vegetation is attributable to anthropogenic forcings, particularly rising atmospheric greenhouse gas levels.126 However, observations127 ,128 ,129 and models130 ,131 ,132 indicate that nutrient limitations and land availability will constrain future land carbon sinks.
Modifications to the water, carbon, and biogeochemical cycles on land result in both positive and negative feedbacks to temperature increases.114 ,133 ,134 Snow and ice albedo feedbacks are positive, leading to increased temperatures with loss of snow and ice extent. While land ecosystems are expected to have a net positive feedback due to reduced natural sinks of CO2 in a warmer world, anthropogenically increased nitrogen deposition may reduce the magnitude of the net feedback.131 ,135 ,136 Increased temperature and reduced precipitation increase wildfire risk and susceptibility of terrestrial ecosystems to pests and disease, with resulting feedbacks on carbon storage. Increased temperature and precipitation, particularly at high latitudes, drives up soil decomposition, which leads to increased CO2 and CH4 (methane) emissions.137 ,138 ,139 ,140 ,141 ,142 ,143 While some of these feedbacks are well known, others are not so well quantified and yet others remain unknown; the potential for surprise is discussed further in Chapter 15: Potential Surprises.
1.7: Global Changes in Sea Ice, Glaciers, and Land Ice
Since NCA3,144 there have been significant advances in the understanding of changes in the cryosphere. Observations continue to show declines in arctic sea ice extent and thickness, Northern Hemisphere snow cover, and the volume of mountain glaciers and continental ice sheets.1 ,145 ,146 ,147 ,148 ,149 Evidence suggests in many cases that the net loss of mass from the global cryosphere is accelerating indicating significant climate feedbacks and societal consequences.150 ,151 ,152 ,153 ,154 ,155
Arctic sea ice areal extent, thickness, and volume have declined since 1979.1 ,146 ,147 ,148 ,156 The annual arctic sea ice extent minimum for 2016 relative to the long-term record was the second lowest (2012 was the lowest) (http://nsidc.org/arcticseaicenews/). The arctic sea ice minimum extents in 2014 and 2015 were also among the lowest on record. Annually averaged arctic sea ice extent has decreased by 3.5%–4.1% per decade since 1979 with much larger reductions in summer and fall.1 ,146 ,148 ,157 For example, September sea ice extent decreased by 13.3% per decade between 1979 and 2016. At the same time, September multi-year sea ice has melted faster than perennial sea ice (13.5% ± 2.5% and 11.5% ± 2.1% per decade, respectively, relative to the 1979–2012 average) corresponding to 4–7.5 feet (1.3–2.3 meter) declines in winter sea ice thickness.1 ,156 October 2016 serves as a recent example of the observed lengthening of the arctic sea ice melt season marking the slowest recorded arctic sea ice growth rate for that month.146 ,158 ,159 The annual arctic sea ice maximum in March 2017 was the lowest maximum areal extent on record (http://nsidc.org/arcticseaicenews/).
While current generation climate models project a nearly ice-free Arctic Ocean in late summer by mid-century, they still simulate weaker reductions in volume and extent than observed, suggesting that projected changes are too conservative.1 ,147 ,160 ,161 See Chapter 11: Arctic Changes for further discussion of the implications of changes in the Arctic.
In contrast to the Arctic, sea ice extent around Antarctica has increased since 1979 by 1.2% to 1.8% per decade.1 Strong regional differences in the sea ice growth rates are found around Antarctica but most regions (about 75%) show increases over the last 30 years.162 The gain in antarctic sea ice is much smaller than the decrease in arctic sea ice. Changes in wind patterns, ice–ocean feedbacks, and freshwater flux have contributed to antarctic sea ice growth.162 ,163 ,164 ,165
Since the NCA3,144 the Gravity Recovery and Climate Experiment (GRACE) constellation (e.g., Velicogna and Wahr 2013166 ) has provided a record of gravimetric land ice measurements, advancing knowledge of recent mass loss from the global cryosphere. These measurements indicate that mass loss from the Antarctic Ice Sheet, Greenland Ice Sheet, and mountain glaciers around the world continues accelerating in some cases.151 ,152 ,154 ,155 ,167 ,168 The annually averaged ice mass from 37 global reference glaciers has decreased every year since 1984, a decline expected to continue even if climate were to stabilize.1 ,153 ,169 ,170
Ice sheet dynamics in West Antarctica are characterized by land ice that transitions to coastal and marine ice sheet systems. Recent observed rapid mass loss from West Antarctica’s floating ice shelves is attributed to increased glacial discharge rates due to diminishing ice shelves from the surrounding ocean becoming warmer.171 ,172 Recent evidence suggests that the Amundsen Sea sector is expected to disintegrate entirely151 ,168 ,172 raising sea level by at least 1.2 meters (about 4 feet) and potentially an additional foot or more on top of current sea level rise projections during this century (see Section 1.2.7 and Ch. 12: Sea Level Rise for further details).173 The potential for unanticipated rapid ice sheet melt and/or disintegration is discussed further in Chapter 15: Potential Surprises.
Over the last decade, the Greenland Ice Sheet mass loss has accelerated, losing 244 ± 6 Gt per year on average between January 2003 and May 2013.1 ,155 ,174 ,175 The portion of the Greenland Ice Sheet experiencing annual melt has increased since 1980 including significant events.1 ,176 ,177 ,178 A recent example, an unprecedented 98.6% of the Greenland Ice Sheet surface experienced melt on a single day in July 2012.179 ,180 Encompassing this event, GRACE data indicate that Greenland lost 562 Gt of mass between April 2012 and April 2013—more than double the average annual mass loss.
In addition, permafrost temperatures and active layer thicknesses have increased across much of the Arctic (also see Ch. 11: Arctic Changes).1 ,181 ,182 Rising permafrost temperatures causing permafrost to thaw and become more discontinuous raises concerns about potential emissions of carbon dioxide and methane.1 The potentially large contribution of carbon and methane emissions from permafrost and the continental shelf in the Arctic to overall warming is discussed further in Chapter 15: Potential Surprises.
1.8: Global Changes in Sea Level
Statistical analyses of tide gauge data indicate that global mean sea level has risen about 8–9 inches (20–23 cm) since 1880, with a rise rate of approximately 0.5–0.6 inches/decade from 1901 to1990 (about 12–15 mm/decade; also see Ch. 12: Sea Level Rise).183 ,184 However, since the early 1990s, both tide gauges and satellite altimeters have recorded a faster rate of sea level rise of about 1.2 inches/decade (approximately 3 cm/decade),183 ,184 ,185 resulting in about 3 inches (about 8 cm) of the global rise since the early 1990s. Nearly two-thirds of the sea level rise measured since 2005 has resulted from increases in ocean mass, primarily from land-based ice melt; the remaining one-third of the rise is in response to changes in density from increasing ocean temperatures.186
Global sea level rise and its regional variability forced by climatic and ocean circulation patterns are contributing to significant increases in annual tidal-flood frequencies, which are measured by NOAA tide gauges and associated with minor infrastructure impacts to date; along some portions of the U.S. coast, frequency of the impacts from such events appears to be accelerating (also see Ch. 12: Sea-Level Rise).187 ,188
Future projections show that by 2100, global mean sea level is very likely to rise by 1.6–4.3 feet (0.5–1.3 m) under the higher scenario (RCP8.5), 1.1–3.1 feet (0.35–0.95 m) under a lower scenario (RCP4.5), and 0.8–2.6 feet (0.24–0.79 m) under and even lower scenario (RCP2.6) (see Ch. 4: Projections for a description of the scenarios).189 Sea level will not rise uniformly around the coasts of the United States and its oversea territories. Local sea level rise is likely to be greater than the global average along the U.S. Atlantic and Gulf Coasts and less than the global average in most of the Pacific Northwest. Emerging science suggests these projections may be underestimates, particularly for higher scenarios; a global mean sea level rise exceeding 8 feet (2.4 m) by 2100 cannot be excluded (see Ch. 12: Sea Level Rise), and even higher amounts are possible as a result of marine ice sheet instability (see Ch. 15: Potential Surprises). We have updated the global sea level rise scenarios for 2100 of Parris et al.190 accordingly,191 and also extended to year 2200 in Chapter 12: Sea Level Rise. The scenarios are regionalized to better match the decision context needed for local risk framing purposes.
1.9: Recent Global Changes Relative to Paleoclimates
Figure 1.9

Proxy temperatures reconstructions for the seven regions of the PAGES 2k Network. Temperature anomalies are relative to the 1961–1990 reference period. If this graph were plotted relative to 1901–1960 instead of 1961–1990, the temperature changes would 0.47°F (0.26°C) higher. Gray lines around expected-value estimates indicate uncertainty ranges as defined by each regional group (see PAGE 2k Consortium9 and related Supplementary Information). Note that the changes in temperature over the last century tend to occur at a much faster rate than found in the previous time periods. The teal values are from the HadCRUT4 surface observation record for land and ocean for the 1800s to 2000.202
(Figure source: adapted from PAGES 2k Consortium 20139 ).
Paleoclimate records demonstrate long-term natural variability in the climate and overlap the records of the last two millennia, referred to here as the “Common Era.” Before the emissions of greenhouse gases from fossil fuels and other human-related activities became a major factor over the last few centuries, the strongest drivers of climate during the last few thousand years had been volcanoes and land-use change (which has both albedo and greenhouse gas emissions effects).192 Based on a number of proxies for temperature (for example, from tree rings, fossil pollen, corals, ocean and lake sediments, and ice cores), temperature records are available for the last 2,000 years on hemispherical and continental scales (Figures 1.8 and 1.9).9 ,193 High-resolution temperature records for North America extend back less than half of this period, with temperatures in the early parts of the Common Era inferred from analyses of pollen and other archives. For this era, there is a general cooling trend, with a relatively rapid increase in temperature over the last 150–200 years (Figure 1.9, ). For context, global annual averaged temperatures for 1986–2015 are likely much higher, and appear to have risen at a more rapid rate during the last 3 decades, than any similar period possibly over the past 2,000 years or longer (IPCC1 makes a similar statement, but for the last 1,400 years because of data quality issues before that time).
Figure 1.8
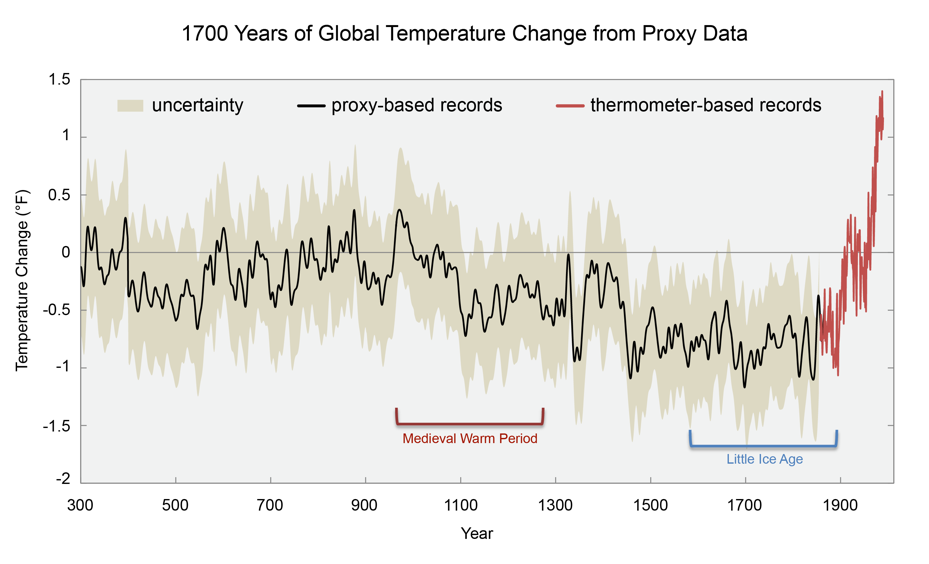
Changes in the temperature of the Northern Hemisphere from surface observations (in red) and from proxies (in black; uncertainty range represented by shading) relative to 1961–1990 average temperature. If this graph were plotted relative to 1901–1960 instead of 1961–1990, the temperature changes would be 0.47°F (0.26°C) higher. These analyses suggest that current temperatures are higher than seen in the Northern Hemisphere, and likely globally, in at least the last 1,700 years, and that the last decade (2006–2015) was the warmest decade on record. (Figure source: adapted from Mann et al. 2008193 ).
Global temperatures of the magnitude observed recently (and projected for the rest of this century) are related to very different forcings than past climates, but studies of past climates suggest that such global temperatures were likely last observed during the Eemian period—the last interglacial—125,000 years ago; at that time, global temperatures were, at their peak, about 1.8°F–3.6°F (1°C–2°C) warmer than preindustrial temperatures.194 Coincident with these higher temperatures, sea levels during that period were about 16–30 feet (6–9 meters) higher than modern levels195 ,196 (for further discussion on sea levels in the past, see Ch. 12: Sea Level Rise).
Modeling studies suggest that the Eemian period warming can be explained in part by the hemispheric changes in solar insolation from orbital forcing as a result of cyclic changes in the shape of Earth’s orbit around the sun (e.g., Kaspar et al. 2005197 ), even though greenhouse gas concentrations were similar to preindustrial levels. Equilibrium climate with modern greenhouse gas concentrations (about 400 ppm CO2) most recently occurred 3 million years ago during the Pliocene. During the warmest parts of this period, global temperatures were 5.4°F–7.2°F (3°C–4°C) higher than today, and sea levels were about 82 feet (25 meters) higher.198
References
- Adler, R. F., G. J. Huffman, A. Chang, R. Ferraro, P.-P. Xie, J. Janowiak, B. Rudolf, U. Schneider, S. Curtis, D. Bolvin, A. Gruber, J. Susskind, P. Arkin, and E. Nelkin, 2003: The version-2 Global Precipitation Climatology Project (GPCP) monthly precipitation analysis (1979–present). Journal of Hydrometeorology, 4, 1147–1167, doi:10.1175/1525-7541(2003)004<1147:TVGPCP>2.0.CO;2. ↩
- Alexander, L. V. et al., 2006: Global observed changes in daily climate extremes of temperature and precipitation. Journal of Geophysical Research, 111, D05109, doi:10.1029/2005JD006290. ↩
- Allen, M. R., and W. J. Ingram, 2002: Constraints on future changes in climate and the hydrologic cycle. Nature, 419, 224–232, doi:10.1038/nature01092. ↩
- Anderson, B. T., J. R. Knight, M. A. Ringer, J.-H. Yoon, and A. Cherchi, 2012: Testing for the possible influence of unknown climate forcings upon global temperature increases from 1950 to 2000. Journal of Climate, 25, 7163–7172, doi:10.1175/jcli-d-11-00645.1. ↩
- Arnell, N. W., and S. N. Gosling, 2016: The impacts of climate change on river flood risk at the global scale. Climatic Change, 134, 387–401, doi:10.1007/s10584-014-1084-5. ↩
- Asadieh, B., and N. Y. Krakauer, 2015: Global trends in extreme precipitation: climate models versus observations. Hydrology and Earth System Sciences, 19, 877–891, doi:10.5194/hess-19-877-2015. ↩
- Balmaseda, M. A., K. E. Trenberth, and E. Källén, 2013: Distinctive climate signals in reanalysis of global ocean heat content. Geophysical Research Letters, 40, 1754–1759, doi:10.1002/grl.50382. ↩
- Barnes, E. A., and L. M. Polvani, 2015: CMIP5 projections of Arctic amplification, of the North American/North Atlantic circulation, and of their relationship. Journal of Climate, 28, 5254–5271, doi:10.1175/JCLI-D-14-00589.1. ↩
- Becker, A., P. Finger, A. Meyer-Christoffer, B. Rudolf, K. Schamm, U. Schneider, and M. Ziese, 2013: A description of the global land-surface precipitation data products of the Global Precipitation Climatology Centre with sample applications including centennial (trend) analysis from 1901–present. Earth System Science Data, 5, 71–99, doi:10.5194/essd-5-71-2013. ↩
- Bender, F. A.-M., V. Ramanathan, and G. Tselioudis, 2012: Changes in extratropical storm track cloudiness 1983–2008: Observational support for a poleward shift. Climate Dynamics, 38, 2037–2053, doi:10.1007/s00382-011-1065-6. ↩
- Benestad, R. E., 2017: A mental picture of the greenhouse effect. Theoretical and Applied Climatology, 128, 679–688, doi:10.1007/s00704-016-1732-y. ↩
- Berghuijs, W. R., R. A. Woods, C. J. Hutton, and M. Sivapalan, 2016: Dominant flood generating mechanisms across the United States. Geophysical Research Letters, 43, 4382–4390, doi:10.1002/2016GL068070. ↩
- Bernier, P. Y., R. L. Desjardins, Y. Karimi-Zindashty, D. Worth, A. Beaudoin, Y. Luo, and S. Wang, 2011: Boreal lichen woodlands: A possible negative feedback to climate change in eastern North America. Agricultural and Forest Meteorology, 151, 521–528, doi:10.1016/j.agrformet.2010.12.013. ↩
- Betts, R. A., O. Boucher, M. Collins, P. M. Cox, P. D. Falloon, N. Gedney, D. L. Hemming, C. Huntingford, C. D. Jones, D. M. H. Sexton, and M. J. Webb, 2007: Projected increase in continental runoff due to plant responses to increasing carbon dioxide. Nature, 448, 1037–1041, doi:10.1038/nature06045. ↩
- Bindoff, N. L., P. A. Stott, K. M. AchutaRao, M. R. Allen, N. Gillett, D. Gutzler, K. Hansingo, G. Hegerl, Y. Hu, S. Jain, I. I. Mokhov, J. Overland, J. Perlwitz, R. Sebbari, and X. Zhang, 2013: Detection and attribution of climate change: From global to regional. T.F. Stocker, D. Qin, G.-K. Plattner, M. Tignor, S.K. Allen, J. Boschung, A. Nauels, Y. Xia, V. Bex, and P.M. Midgley, Eds., Cambridge University Press, 867–952. URL ↩
- Blunden, J., and D. S. Arndt, 2016: State of the climate in 2015. Bulletin of the American Meteorological Society, 97, Si – S275, doi:10.1175/2016BAMSStateoftheClimate.1. ↩
- Bonan, G. B., 2008: Forests and Climate Change: Forcings, Feedbacks, and the Climate Benefits of Forests. Science, 320, 1444–1449, doi:10.1126/science.1155121. ↩
- Callaghan, T. V. et al., 2011: Multiple effects of changes in Arctic snow cover. Ambio, 40, 32–45, doi:10.1007/s13280-011-0213-x. ↩
- Chambers, J. Q., J. I. Fisher, H. Zeng, E. L. Chapman, D. B. Baker, and G. C. Hurtt, 2007: Hurricane Katrina’s carbon footprint on U.S. Gulf Coast forests. Science, 318, 1107–1107, doi:10.1126/science.1148913. ↩
- Chang, E. K. M., 2013: CMIP5 projection of significant reduction in extratropical cyclone activity over North America. Journal of Climate, 26, 9903–9922, doi:10.1175/JCLI-D-13-00209.1. ↩
- Chen, X., and K.-K. Tung, 2014: Varying planetary heat sink led to global-warming slowdown and acceleration. Science, 345, 897–903, doi:10.1126/science.1254937. ↩
- Church, J. A., N. J. White, L. F. Konikow, C. M. Domingues, J. G. Cogley, E. Rignot, J. M. Gregory, M. R. van den Broeke, A. J. Monaghan, and I. Velicogna, 2011: Revisiting the Earth’s sea-level and energy budgets from 1961 to 2008. Geophysical Research Letters, 38, L18601, doi:10.1029/2011GL048794. ↩
- Church, J. A., and N. J. White, 2011: Sea-level rise from the late 19th to the early 21st century. Surveys in Geophysics, 32, 585–602, doi:10.1007/s10712-011-9119-1. ↩
- Churkina, G., V. Brovkin, W. von Bloh, K. Trusilova, M. Jung, and F. Dentener, 2009: Synergy of rising nitrogen depositions and atmospheric CO2 on land carbon uptake moderately offsets global warming. Global Biogeochemical Cycles, 23, GB4027, doi:10.1029/2008GB003291. ↩
- Ciais, P. et al., 2005: Europe-wide reduction in primary productivity caused by the heat and drought in 2003. Nature, 437, 529–533, doi:10.1038/nature03972. ↩
- Clark, D. B., D. A. Clark, and S. F. Oberbauer, 2010: Annual wood production in a tropical rain forest in NE Costa Rica linked to climatic variation but not to increasing CO2. Global Change Biology, 16, 747–759, doi:10.1111/j.1365-2486.2009.02004.x. ↩
- Colle, B. A., Z. Zhang, K. A. Lombardo, E. Chang, P. Liu, and M. Zhang, 2013: Historical evaluation and future prediction of eastern North American and western Atlantic extratropical cyclones in the CMIP5 models during the cool season. Journal of Climate, 26, 6882–6903, doi:10.1175/JCLI-D-12-00498.1. ↩
- Collins, M., R. Knutti, J. Arblaster, J.-L. Dufresne, T. Fichefet, P. Friedlingstein, X. Gao, W. J. Gutowski, T. Johns, G. Krinner, M. Shongwe, C. Tebaldi, A. J. Weaver, and M. Wehner, 2013: Long-term climate change: Projections, commitments and irreversibility. T.F. Stocker, D. Qin, G.-K. Plattner, M. Tignor, S.K. Allen, J. Boschung, A. Nauels, Y. Xia, V. Bex, and P.M. Midgley, Eds., Cambridge University Press, 1029–1136. URL ↩
- Comiso, J. C., and D. K. Hall, 2014: Climate trends in the Arctic as observed from space. Wiley Interdisciplinary Reviews: Climate Change, 5, 389–409, doi:10.1002/wcc.277. ↩
- Dai, A., 2013: Increasing drought under global warming in observations and models. Nature Climate Change, 3, 52–58, doi:10.1038/nclimate1633. ↩
- Davy, R., I. Esau, A. Chernokulsky, S. Outten, and S. Zilitinkevich, 2016: Diurnal asymmetry to the observed global warming. International Journal of Climatology, 37, 79–93, doi:10.1002/joc.4688. ↩
- DeConto, R. M., and D. Pollard, 2016: Contribution of Antarctica to past and future sea-level rise. Nature, 531, 591–597, doi:10.1038/nature17145. ↩
- Delworth, T. L., and T. R. Knutson, 2000: Simulation of early 20th century global warming. Science, 287, 2246–2250, doi:10.1126/science.287.5461.2246. ↩
- Derksen, C., and R. Brown, 2012: Spring snow cover extent reductions in the 2008–2012 period exceeding climate model projections. Geophysical Research Letters, 39, L19504, doi:10.1029/2012gl053387. ↩
- Derksen, D., R. Brown, L. Mudryk, and K. Loujus, 2015: [The Arctic] Terrestrial snow cover [in “State of the Climate in 2014”]. Bulletin of the American Meteorological Society, 96 (12), S133–S135, doi:10.1175/2015BAMSStateoftheClimate.1. ↩
- Deser, C., R. Knutti, S. Solomon, and A. S. Phillips, 2012: Communication of the role of natural variability in future North American climate. Nature Climate Change, 2, 775–779, doi:10.1038/nclimate1562. ↩
- Diffenbaugh, N. S., M. Scherer, and R. J. Trapp, 2013: Robust increases in severe thunderstorm environments in response to greenhouse forcing. Proceedings of the National Academy of Sciences, 110, 16361–16366, doi:10.1073/pnas.1307758110. ↩
- Donat, M. G., A. L. Lowry, L. V. Alexander, P. A. Ogorman, and N. Maher, 2016: More extreme precipitation in the world’s dry and wet regions. Nature Climate Change, 6, 508–513, doi:10.1038/nclimate2941. ↩
- Dutton, A., and K. Lambeck, 2012: Ice volume and sea level during the Last Interglacial. Science, 337, 216–219, doi:10.1126/science.1205749. ↩
- EPA, 2016: Climate Change Indicators in the United States, 2016. 4th edition. 96 pp., U.S. Environmental Protection Agency. URL ↩
- Easterling, D. R., K. E. Kunkel, M. F. Wehner, and L. Sun, 2016: Detection and attribution of climate extremes in the observed record. Weather and Climate Extremes, 11, 17–27, doi:10.1016/j.wace.2016.01.001. ↩
- Eisenman, I., W. N. Meier, and J. R. Norris, 2014: A spurious jump in the satellite record: Has Antarctic sea ice expansion been overestimated? The Cryosphere, 8, 1289–1296, doi:10.5194/tc-8-1289-2014. ↩
- Elsner, J. B., J. P. Kossin, and T. H. Jagger, 2008: The increasing intensity of the strongest tropical cyclones. Nature, 455, 92–95, doi:10.1038/nature07234. ↩
- Emanuel, K. A., 2013: Downscaling CMIP5 climate models shows increased tropical cyclone activity over the 21st century. Proceedings of the National Academy of Sciences, 110, 12219–12224, doi:10.1073/pnas.1301293110. ↩
- England, M. H., S. McGregor, P. Spence, G. A. Meehl, A. Timmermann, W. Cai, A. S. Gupta, M. J. McPhaden, A. Purich, and A. Santoso, 2014: Recent intensification of wind-driven circulation in the Pacific and the ongoing warming hiatus. Nature Climate Change, 4, 222–227, doi:10.1038/nclimate2106. ↩
- Ezer, T., and L. P. Atkinson, 2014: Accelerated flooding along the U.S. East Coast: On the impact of sea-level rise, tides, storms, the Gulf Stream, and the North Atlantic Oscillations. Earth’s Future, 2, 362–382, doi:10.1002/2014EF000252. ↩
- Feldmann, J., and A. Levermann, 2015: Collapse of the West Antarctic Ice Sheet after local destabilization of the Amundsen Basin. Proceedings of the National Academy of Sciences, 112, 14191–14196, doi:10.1073/pnas.1512482112. ↩
- Fettweis, X., M. Tedesco, M. van den Broeke, and J. Ettema, 2011: Melting trends over the Greenland ice sheet (1958–2009) from spaceborne microwave data and regional climate models. The Cryosphere, 5, 359–375, doi:10.5194/tc-5-359-2011. ↩
- Finzi, A. C., D. J. P. Moore, E. H. DeLucia, J. Lichter, K. S. Hofmockel, R. B. Jackson, H.-S. Kim, R. Matamala, H. R. McCarthy, R. Oren, J. S. Pippen, and W. H. Schlesinger, 2006: Progressive nitrogen limitation of ecosystem processes under elevated CO2 in a warm-temperate forest. Ecology, 87, 15–25, doi:10.1890/04-1748. ↩
- Fischer, E. M., and R. Knutti, 2016: Observed heavy precipitation increase confirms theory and early models. Nature Climate Change, 6, 986–991, doi:10.1038/nclimate3110. ↩
- Fyfe, J. C., G. A. Meehl, M. H. England, M. E. Mann, B. D. Santer, G. M. Flato, E. Hawkins, N. P. Gillett, S.-P. Xie, Y. Kosaka, and N. C. Swart, 2016: Making sense of the early-2000s warming slowdown. Nature Climate Change, 6, 224–228, doi:10.1038/nclimate2938. ↩
- Greve, P., B. Orlowsky, B. Mueller, J. Sheffield, M. Reichstein, and S. I. Seneviratne, 2014: Global assessment of trends in wetting and drying over land. Nature Geoscience, 7, 716–721, doi:10.1038/ngeo2247. ↩
- Harig, C., and F. J. Simons, 2012: Mapping Greenland’s mass loss in space and time. Proceedings of the National Academy of Sciences, 109, 19934–19937, doi:10.1073/pnas.1206785109. ↩
- Harig, C., and F. J. Simons, 2015: Accelerated West Antarctic ice mass loss continues to outpace East Antarctic gains. Earth and Planetary Science Letters, 415, 134–141, doi:10.1016/j.epsl.2015.01.029. ↩
- Harig, C., and F. J. Simons, 2016: Ice mass loss in Greenland, the Gulf of Alaska, and the Canadian Archipelago: Seasonal cycles and decadal trends. Geophysical Research Letters, 43, 3150–3159, doi:10.1002/2016GL067759. ↩
- Hausfather, Z., K. Cowtan, D. C. Clarke, P. Jacobs, M. Richardson, and R. Rohde, 2017: Assessing recent warming using instrumentally homogeneous sea surface temperature records. Science Advances, 3, e1601207, doi:10.1126/sciadv.1601207. ↩
- Hay, C. C., E. Morrow, R. E. Kopp, and J. X. Mitrovica, 2015: Probabilistic reanalysis of twentieth-century sea-level rise. Nature, 517, 481–484, doi:10.1038/nature14093. ↩
- Haywood, A. M. et al., 2013: Large-scale features of Pliocene climate: Results from the Pliocene Model Intercomparison Project. Climate of the Past, 9, 191–209, doi:10.5194/cp-9-191-2013. ↩
- Held, I. M., and B. J. Soden, 2006: Robust responses of the hydrological cycle to global warming. Journal of Climate, 19, 5686–5699, doi:10.1175/jcli3990.1. ↩
- Hoegh-Guldberg, O., R. Cai, E. S. Poloczanska, P. G. Brewer, S. Sundby, K. Hilmi, V. J. Fabry, and S. Jung, 2014: The Ocean. V.R. Barros, C.B. Field, D.J. Dokken, M.D. Mastrandrea, K.J. Mach, T.E. Bilir, M. Chatterjee, K.L. Ebi, Y.O. Estrada, R.C. Genova, B. Girma, E.S. Kissel, A.N. Levy, S. MacCracken, P.R. Mastrandrea, and L.L. White, Eds., Cambridge University Press, 1655–1731. URL ↩
- Hoerling, M., M. Chen, R. Dole, J. Eischeid, A. Kumar, J. W. Nielsen-Gammon, P. Pegion, J. Perlwitz, X.-W. Quan, and T. Zhang, 2013: Anatomy of an extreme event. Journal of Climate, 26, 2811–2832, doi:10.1175/JCLI-D-12-00270.1. ↩
- Horton, D. E., N. C. Johnson, D. Singh, D. L. Swain, B. Rajaratnam, and N. S. Diffenbaugh, 2015: Contribution of changes in atmospheric circulation patterns to extreme temperature trends. Nature, 522, 465–469, doi:10.1038/nature14550. ↩
- Houghton, R. A., J. I. House, J. Pongratz, G. R. van der Werf, R. S. DeFries, M. C. Hansen, C. Le Quéré, and N. Ramankutty, 2012: Carbon emissions from land use and land-cover change. Biogeosciences, 9, 5125–5142, doi:10.5194/bg-9-5125-2012. ↩
- Huber, M., and R. Knutti, 2014: Natural variability, radiative forcing and climate response in the recent hiatus reconciled. Nature Geoscience, 7, 651–656, doi:10.1038/ngeo2228. ↩
- Hulme, M., 2014: Attributing weather extremes to “climate change.” Progress in Physical Geography, 38, 499–511, doi:10.1177/0309133314538644. ↩
- Hurrell, J. W., and C. Deser, 2009: North Atlantic climate variability: The role of the North Atlantic oscillation. Journal of Marine Systems, 78, 28–41, doi:10.1016/j.jmarsys.2008.11.026. ↩
- IPCC, 2013: Climate Change 2013: The Physical Science Basis. Contribution of Working Group I to the Fifth Assessment Report of the Intergovernmental Panel on Climate Change. 1535 pp., Cambridge University Press. ↩
- Initiative, M. R., 2015: Elevation-dependent warming in mountain regions of the world. Nature Climate Change, 5, 424–430, doi:10.1038/nclimate2563. ↩
- Jacob, T., J. Wahr, W. T. Pfeffer, and S. Swenson, 2012: Recent contributions of glaciers and ice caps to sea level rise. Nature, 482, 514–518, doi:10.1038/nature10847. ↩
- Jenkins, A., P. Dutrieux, S. S. Jacobs, S. D. McPhail, J. R. Perrett, A. T. Webb, and D. White, 2010: Observations beneath Pine Island Glacier in West Antarctica and implications for its retreat. Nature Geoscience, 3, 468–472, doi:10.1038/ngeo890. ↩
- Johnson, G. C., J. M. Lyman, J. Antonov, N. Bindoff, T. Boyer, C. M. Domingues, S. A. Good, M. Ishii, and J. K. Willis, 2015: Ocean heat content [in “State of the Climate in 2014”]. Bulletin of the American Meteorological Society, 96 (7), S64–S66, S68, doi:10.1175/2014BAMSStateoftheClimate.1. ↩
- Jones, D. A., W. Wang, and R. Fawcett, 2009: High-quality spatial climate data-sets for Australia. Australian Meteorological and Oceanographic Journal, 58, 233–248, doi:10.22499/2.5804.003 . ↩
- Jones, P. D., D. H. Lister, T. J. Osborn, C. Harpham, M. Salmon, and C. P. Morice, 2012: Hemispheric and large-scale land surface air temperature variations: An extensive revision and an update to 2010. Journal Of Geophysical Research, 117, doi:10.1029/2011JD017139. ↩
- Joughin, I., B. E. Smith, and B. Medley, 2014: Marine ice sheet collapse potentially under way for the Thwaites Glacier Basin, West Antarctica. Science, 344, 735–738, doi:10.1126/science.1249055. ↩
- Karl, T. R., A. Arguez, B. Huang, J. H. Lawrimore, J. R. McMahon, M. J. Menne, T. C. Peterson, R. S. Vose, and H.-M. Zhang, 2015: Possible artifacts of data biases in the recent global surface warming hiatus. Science, 348, 1469–1472, doi:10.1126/science.aaa5632. ↩
- Kaspar, F., N. Kühl, U. Cubasch, and T. Litt, 2005: A model-data comparison of European temperatures in the Eemian interglacial. Geophysical Research Letters, 32, L11703, doi:10.1029/2005GL022456. ↩
- Katz, R. W., and B. G. Brown, 1992: Extreme events in a changing climate: Variability is more important than averages. Climatic Change, 21, 289–302, doi:10.1007/bf00139728. ↩
- Kim, Y., J. Kimball, K. Zhang, and K. McDonald, 2012: Satellite detection of increasing Northern Hemisphere non-frozen seasons from 1979 to 2008: Implications for regional vegetation growth. Remote Sensing of Environment, 121, 472–487, doi:10.1016/j.rse.2012.02.014. ↩
- Knutson, T. R., J. J. Sirutis, M. Zhao, R. E. Tuleya, M. Bender, G. A. Vecchi, G. Villarini, and D. Chavas, 2015: Global projections of intense tropical cyclone activity for the late twenty-first century from dynamical downscaling of CMIP5/RCP4.5 scenarios. Journal of Climate, 28, 7203–7224, doi:10.1175/JCLI-D-15-0129.1. ↩
- Knutson, T. R., R. Zhang, and L. W. Horowitz, 2016: Prospects for a prolonged slowdown in global warming in the early 21st century. Nature Communcations, 7, 13676, doi:10.1038/ncomms13676. ↩
- Knutti, R., J. Rogelj, J. Sedlacek, and E. M. Fischer, 2016: A scientific critique of the two-degree climate change target. Nature Geoscience, 9, 13–18, doi:10.1038/ngeo2595. ↩
- Kopp, G., 2014: An assessment of the solar irradiance record for climate studies. Journal of Space Weather and Space Climate, 4, A14, doi:10.1051/swsc/2014012. ↩
- Kopp, R. E., F. J. Simons, J. X. Mitrovica, A. C. Maloof, and M. Oppenheimer, 2009: Probabilistic assessment of sea level during the last interglacial stage. Nature, 462, 863–867, doi:10.1038/nature08686. ↩
- Kopp, R. E., R. M. Horton, C. M. Little, J. X. Mitrovica, M. Oppenheimer, D. J. Rasmussen, B. H. Strauss, and C. Tebaldi, 2014: Probabilistic 21st and 22nd century sea-level projections at a global network of tide-gauge sites. Earth’s Future, 2, 383–406, doi:10.1002/2014EF000239. ↩
- Kosaka, Y., and S.-P. Xie, 2013: Recent global-warming hiatus tied to equatorial Pacific surface cooling. Nature, 501, 403–407, doi:10.1038/nature12534. ↩
- Kossin, J. P., K. A. Emanuel, and G. A. Vecchi, 2014: The poleward migration of the location of tropical cyclone maximum intensity. Nature, 509, 349–352, doi:10.1038/nature13278. ↩
- Kossin, J. P., K. A. Emanuel, and S. J. Camargo, 2016: Past and projected changes in western North Pacific tropical cyclone exposure. Journal of Climate, 29, 5725–5739, doi:10.1175/JCLI-D-16-0076.1. ↩
- Kossin, J. P., T. L. Olander, and K. R. Knapp, 2013: Trend analysis with a new global record of tropical cyclone intensity. Journal of Climate, 26, 9960–9976, doi:10.1175/JCLI-D-13-00262.1. ↩
- Kundzewicz, Z. W., 2008: Climate change impacts on the hydrological cycle. Ecohydrology & Hydrobiology, 8, 195–203, doi:10.2478/v10104-009-0015-y. ↩
- Kundzewicz, Z. W., S. Kanae, S. I. Seneviratne, J. Handmer, N. Nicholls, P. Peduzzi, R. Mechler, L. M. Bouwer, N. Arnell, K. Mach, R. Muir-Wood, G. R. Brakenridge, W. Kron, G. Benito, Y. Honda, K. Takahashi, and B. Sherstyukov, 2014: Flood risk and climate change: Global and regional perspectives. Hydrological Sciences Journal, 59, 1–28, doi:10.1080/02626667.2013.857411. ↩
- Kunkel, K. E. et al., 2013: Monitoring and understanding trends in extreme storms: State of knowledge. Bulletin of the American Meteorological Society, 94, doi:10.1175/BAMS-D-11-00262.1. ↩
- Kunkel, K. E., D. A. Robinson, S. Champion, X. Yin, T. Estilow, and R. M. Frankson, 2016: Trends and extremes in Northern Hemisphere snow characteristics. Current Climate Change Reports, 2, 65–73, doi:10.1007/s40641-016-0036-8. ↩
- Kunkel, K. E., and R. M. Frankson, 2015: Global land surface extremes of precipitation: Data limitations and trends. Journal of Extreme Events, 02, 1550004, doi:10.1142/S2345737615500049. ↩
- Kurz, W. A., G. Stinson, G. J. Rampley, C. C. Dymond, and E. T. Neilson, 2008: Risk of natural disturbances makes future contribution of Canada’s forests to the global carbon cycle highly uncertain. Proceedings of the National Academy of Sciences, 105, 1551–1555, doi:10.1073/pnas.0708133105. ↩
- Le Quéré, C. et al., 2015: Global carbon budget 2015. Earth System Science Data, 7, 349–396, doi:10.5194/essd-7-349-2015. ↩
- Le Quéré, C. et al., 2016: Global carbon budget 2016. Earth System Science Data, 8, 605–649, doi:10.5194/essd-8-605-2016. ↩
- Lehmann, J., D. Coumou, and K. Frieler, 2015: Increased record-breaking precipitation events under global warming. Climatic Change, 132, 501–515, doi:10.1007/s10584-015-1434-y. ↩
- Lewandowsky, S., J. S. Risbey, and N. Oreskes, 2016: The “pause” in global warming: Turning a routine fluctuation into a problem for science. Bulletin of the American Meteorological Society, 97, 723–733, doi:10.1175/BAMS-D-14-00106.1. ↩
- Lewis, S. L., P. M. Brando, O. L. Phillips, G. M. F. van der Heijden, and D. Nepstad, 2011: The 2010 Amazon drought. Science, 331, 554–554, doi:10.1126/science.1200807. ↩
- Mann, M. E., Z. Zhang, M. K. Hughes, R. S. Bradley, S. K. Miller, S. Rutherford, and F. Ni, 2008: Proxy-based reconstructions of hemispheric and global surface temperature variations over the past two millennia. Proceedings of the National Academy of Sciences, 105, 13252–13257, doi:10.1073/pnas.0805721105. ↩
- Mao, J., A. Ribes, B. Yan, X. Shi, P. E. Thornton, R. Seferian, P. Ciais, R. B. Myneni, H. Douville, S. Piao, Z. Zhu, R. E. Dickinson, Y. Dai, D. M. Ricciuto, M. Jin, F. M. Hoffman, B. Wang, M. Huang, and X. Lian, 2016: Human-induced greening of the northern extratropical land surface. Nature Climate Change, 6, 959–963, doi:10.1038/nclimate3056. ↩
- Marcott, S. A., J. D. Shakun, P. U. Clark, and A. C. Mix, 2013: A reconstruction of regional and global temperature for the past 11,300 years. Science, 339, 1198–1201, doi:10.1126/science.1228026. ↩
- Marotzke, J., and P. M. Forster, 2015: Forcing, feedback and internal variability in global temperature trends. Nature, 517, 565–570, doi:10.1038/nature14117. ↩
- Marvel, K., and C. Bonfils, 2013: Identifying external influences on global precipitation. Proceedings of the National Academy of Sciences, 110, 19301–19306, doi:10.1073/pnas.1314382110. ↩
- Mears, C. A., and F. J. Wentz, 2016: Sensitivity of satellite-derived tropospheric temperature trends to the diurnal cycle adjustment. Journal of Climate, 29, 3629–3646, doi:10.1175/JCLI-D-15-0744.1. ↩
- Meehl, G. A., A. Hu, B. D. Santer, and S.-P. Xie, 2016: Contribution of the Interdecadal Pacific Oscillation to twentieth-century global surface temperature trends. Nature Climate Change, 6, 1005–1008, doi:10.1038/nclimate3107. ↩
- Meehl, G. A., C. Tebaldi, G. Walton, D. Easterling, and L. McDaniel, 2009: Relative increase of record high maximum temperatures compared to record low minimum temperatures in the US. Geophysical Research Letters, 36, L23701, doi:10.1029/2009GL040736. ↩
- Meehl, G. A., J. M. Arblaster, C. M. Bitz, C. T. Y. Chung, and H. Teng, 2016: Antarctic sea-ice expansion between 2000 and 2014 driven by tropical Pacific decadal climate variability. Nature Geoscience, 9, 590–595, doi:10.1038/ngeo2751. ↩
- Meehl, G. A., J. M. Arblaster, J. T. Fasullo, A. Hu, and K. E. Trenberth, 2011: Model-based evidence of deep-ocean heat uptake during surface-temperature hiatus periods. Nature Climate Change, 1, 360–364, doi:10.1038/nclimate1229. ↩
- Melillo, J. M., T. (T. C. . Richmond, and G. W. Yohe, eds., 2014: Climate Change Impacts in the United States: The Third National Climate Assessment. U.S. Global Change Research Program, 841 pp. ↩
- Mengel, M., A. Levermann, K. Frieler, A. Robinson, B. Marzeion, and R. Winkelmann, 2016: Future sea level rise constrained by observations and long-term commitment. Proceedings of the National Academy of Sciences, 113, 2597–2602, doi:10.1073/pnas.1500515113. ↩
- Menzel, A. et al., 2006: European phenological response to climate change matches the warming pattern. Global Change Biology, 12, 1969–1976, doi:10.1111/j.1365-2486.2006.01193.x. ↩
- Merrifield, M. A., P. Thompson, E. Leuliette, G. T. Mitchum, D. P. Chambers, S. Jevrejeva, R. S. Nerem, M. Menéndez, W. Sweet, B. Hamlington, and J. J. Marra, 2015: [Global Oceans] Sea level variability and change [in “State of the Climate in 2014”]. Bulletin of the American Meteorological Society, 96 (12), S82–S85, doi:10.1175/2015BAMSStateoftheClimate.1. ↩
- Min, S. K., X. Zhang, F. W. Zwiers, and G. C. Hegerl, 2011: Human contribution to more-intense precipitation extremes. Nature, 470, 378–381, doi:10.1038/nature09763. ↩
- Min, S.-K., X. Zhang, F. Zwiers, H. Shiogama, Y.-S. Tung, and M. Wehner, 2013: Multimodel detection and attribution of extreme temperature changes. Journal of Climate, 26, 7430–7451, doi:10.1175/JCLI-D-12-00551.1. ↩
- Min, S.-K., X. Zhang, and F. Zwiers, 2008: Human-induced Arctic moistening. Science, 320, 518–520, doi:10.1126/science.1153468. ↩
- Myneni, R. B., C. D. Keeling, C. J. Tucker, G. Asrar, and R. R. Nemani, 1997: Increased plant growth in the northern high latitudes from 1981 to 1991. Nature, 386, 698–702, doi:10.1038/386698a0. ↩
- NAS, 2016: Attribution of Extreme Weather Events in the Context of Climate Change. The National Academies Press, 186 pp. ↩
- NCEI, 2016: Climate at a Glance: Global Temperature Anomalies. URL ↩
- NSIDC, 2016: Sluggish Ice Growth in the Arctic. Arctic Sea Ice News and Analysis, National Snow and Ice Data Center. URL ↩
- NSIDC, 2017: SOTC (State of the Cryosphere): Northern Hemisphere Snow. National Snow and Ice Data Center. URL ↩
- Nerem, R. S., D. P. Chambers, C. Choe, and G. T. Mitchum, 2010: Estimating mean sea level change from the TOPEX and Jason altimeter missions. Marine Geodesy, 33, 435–446, doi:10.1080/01490419.2010.491031. ↩
- Nghiem, S. V., D. K. Hall, T. L. Mote, M. Tedesco, M. R. Albert, K. Keegan, C. A. Shuman, N. E. DiGirolamo, and G. Neumann, 2012: The extreme melt across the Greenland ice sheet in 2012. Geophysical Research Letters, 39, L20502, doi:10.1029/2012GL053611. ↩
- Nieves, V., J. K. Willis, and W. C. Patzert, 2015: Recent hiatus caused by decadal shift in Indo-Pacific heating. Science, 349, 532–535, doi:10.1126/science.aaa4521. ↩
- Norby, R. J., J. M. Warren, C. M. Iversen, B. E. Medlyn, and R. E. McMurtrie, 2010: CO2 enhancement of forest productivity constrained by limited nitrogen availability. Proceedings of the National Academy of Sciences, 107, 19368–19373, doi:10.1073/pnas.1006463107. ↩
- Otto-Bliesner, B. L., E. C. Brady, J. Fasullo, A. Jahn, L. Landrum, S. Stevenson, N. Rosenbloom, A. Mai, and G. Strand, 2016: Climate Variability and Change since 850 CE: An Ensemble Approach with the Community Earth System Model. Bulletin of the American Meteorological Society, 97, 735–754, doi:10.1175/bams-d-14-00233.1. ↩
- PAGES 2K Consortium, 2013: Continental-scale temperature variability during the past two millennia. Nature Geoscience, 6, 339–346, doi:10.1038/ngeo1797. ↩
- Page, S. E., F. Siegert, J. O. Rieley, H.-D. V. Boehm, A. Jaya, and S. Limin, 2002: The amount of carbon released from peat and forest fires in Indonesia during 1997. Nature, 420, 61–65, doi:10.1038/nature01131. ↩
- Palmroth, S., R. Oren, H. R. McCarthy, K. H. Johnsen, A. C. Finzi, J. R. Butnor, M. G. Ryan, and W. H. Schlesinger, 2006: Aboveground sink strength in forests controls the allocation of carbon below ground and its [CO2]-induced enhancement. Proceedings of the National Academy of Sciences, 103, 19362–19367, doi:10.1073/pnas.0609492103. ↩
- Pan, Y., R. A. Birdsey, J. Fang, R. Houghton, P. E. Kauppi, W. A. Kurz, O. L. Phillips, A. Shvidenko, S. L. Lewis, J. G. Canadell, P. Ciais, R. B. Jackson, S. W. Pacala, A. D. McGuire, S. Piao, A. Rautiainen, S. Sitch, and D. Hayes, 2011: A large and persistent carbon sink in the world’s forests. Science, 333, 988–993, doi:10.1126/science.1201609. ↩
- Parkinson, C. L., 2014: Spatially mapped reductions in the length of the Arctic sea ice season. Geophysical Research Letters, 41, 4316–4322, doi:10.1002/2014GL060434. ↩
- Parris, A., P. Bromirski, V. Burkett, D. Cayan, M. Culver, J. Hall, R. Horton, K. Knuuti, R. Moss, J. Obeysekera, A. Sallenger, and J. Weiss, 2012: Global Sea Level Rise Scenarios for the United States National Climate Assessment. NOAA Tech Memo OAR CPO-1. 37 pp., National Oceanic and Atmospheric Administration. URL ↩
- Pauling, A. G., C. M. Bitz, I. J. Smith, and P. J. Langhorne, 2016: The response of the Southern Ocean and Antarctic sea ice to freshwater from ice shelves in an Earth system model. Journal of Climate, 29, 1655–1672, doi:10.1175/JCLI-D-15-0501.1. ↩
- Pelto, M. S., 2015: [Global Climate] Alpine glaciers [in “State of the Climate in 2014”]. Bulletin of the American Meteorological Society, 96 (12), S19–S20, doi:10.1175/2015BAMSStateoftheClimate.1. ↩
- Perovich, D., S. Gerlnad, S. Hendricks, W. Meier, M. Nicolaus, and M. Tschudi, 2015: [The Arctic] Sea ice cover [in “State of the Climate in 2014”]. Bulletin of the American Meteorological Society, 96 (12), S145–S146, doi:10.1175/2015BAMSStateoftheClimate.1. ↩
- Peters, G. P., R. M. Andrew, T. Boden, J. G. Canadell, P. Ciais, C. Le Quere, G. Marland, M. R. Raupach, and C. Wilson, 2013: The challenge to keep global warming below 2°C. Nature Climate Change, 3, 4–6, doi:10.1038/nclimate1783. ↩
- Peterson, T. C. et al., 2013: Monitoring and understanding changes in heat waves, cold waves, floods and droughts in the United States: State of knowledge. Bulletin of the American Meteorological Society, 94, 821–834, doi:10.1175/BAMS-D-12-00066.1. ↩
- Rahmstorf, S., J. E. Box, G. Feulner, M. E. Mann, A. Robinson, S. Rutherford, and E. J. Schaffernicht, 2015: Exceptional twentieth-century slowdown in Atlantic Ocean overturning circulation. Nature Climate Change, 5, 475–480, doi:10.1038/nclimate2554. ↩
- Ramsayer, K., 2014: Antarctic sea ice reaches new record maximum. URL ↩
- Reyes-Fox, M., H. Steltzer, M. J. Trlica, G. S. McMaster, A. A. Andales, D. R. LeCain, and J. A. Morgan, 2014: Elevated CO2 further lengthens growing season under warming conditions. Nature, 510, 259–262, doi:10.1038/nature13207. ↩
- Rhein, M., S. R. Rintoul, S. Aoki, E. Campos, D. Chambers, R. A. Feely, S. Gulev, G. C. Johnson, S. A. Josey, A. Kostianoy, C. Mauritzen, D. Roemmich, L. D. Talley, and F. Wang, 2013: Observations: Ocean. T.F. Stocker, D. Qin, G.-K. Plattner, M. Tignor, S.K. Allen, J. Boschung, A. Nauels, Y. Xia, V. Bex, and P.M. Midgley, Eds., Cambridge University Press, 255–316. URL ↩
- Richardson, M., K. Cowtan, E. Hawkins, and M. B. Stolpe, 2016: Reconciled climate response estimates from climate models and the energy budget of Earth. Nature Climate Change, 6, 931–935, doi:10.1038/nclimate3066. ↩
- Ridley, D. A., S. Solomon, J. E. Barnes, V. D. Burlakov, T. Deshler, S. I. Dolgii, A. B. Herber, T. Nagai, R. R. Neely, A. V. Nevzorov, C. Ritter, T. Sakai, B. D. Santer, M. Sato, A. Schmidt, O. Uchino, and J. P. Vernier, 2014: Total volcanic stratospheric aerosol optical depths and implications for global climate change. Geophysical Research Letters, 41, 7763–7769, doi:10.1002/2014GL061541. ↩
- Rignot, E., I. Velicogna, M. R. van den Broeke, A. Monaghan, and J. T. M. Lenaerts, 2011: Acceleration of the contribution of the Greenland and Antarctic ice sheets to sea level rise. Geophysical Research Letters, 38, L05503, doi:10.1029/2011GL046583. ↩
- Rignot, E., J. Mouginot, M. Morlighem, H. Seroussi, and B. Scheuchl, 2014: Widespread, rapid grounding line retreat of Pine Island, Thwaites, Smith, and Kohler Glaciers, West Antarctica, from 1992 to 2011. Geophysical Research Letters, 41, 3502–3509, doi:10.1002/2014GL060140. ↩
- Romanovsky, V. E., S. L. Smith, H. H. Christiansen, N. I. Shiklomanov, D. A. Streletskiy, D. S. Drozdov, G. V. Malkova, N. G. Oberman, A. L. Kholodov, and S. S. Marchenko, 2015: [The Arctic] Terrestrial permafrost [in “State of the Climate in 2014”]. Bulletin of the American Meteorological Society, 96 (12), S139–S141, doi:10.1175/2015BAMSStateoftheClimate.1. ↩
- Rupp, D. E., P. W. Mote, N. L. Bindoff, P. A. Stott, and D. A. Robinson, 2013: Detection and attribution of observed changes in Northern Hemisphere spring snow cover. Journal of Climate, 26, 6904–6914, doi:10.1175/JCLI-D-12-00563.1. ↩
- Sander, J., J. F. Eichner, E. Faust, and M. Steuer, 2013: Rising variability in thunderstorm-related U.S. losses as a reflection of changes in large-scale thunderstorm forcing. Weather, Climate, and Society, 5, 317–331, doi:10.1175/WCAS-D-12-00023.1. ↩
- Santer, B. D., C. Bonfils, J. F. Painter, M. D. Zelinka, C. Mears, S. Solomon, G. A. Schmidt, J. C. Fyfe, J. N. S. Cole, L. Nazarenko, K. E. Taylor, and F. J. Wentz, 2014: Volcanic contribution to decadal changes in tropospheric temperature. Nature Geoscience, 7, 185–189, doi:10.1038/ngeo2098. ↩
- Santer, B. D., C. Mears, F. J. Wentz, K. E. Taylor, P. J. Gleckler, T. M. . Wigley, T. P. Barnett, J. S. Boyle, W. Brüggemann, N. P. Gillett, S. A. Klein, G. A. Meehl, T. Nozawa, D. W. Pierce, P. A. Stott, W. M. Washington, and M. F. Wehner, 2007: Identification of human-induced changes in atmospheric moisture content. Proceedings of the National Academy of Sciences, 104, 15248–15253, doi:10.1073/pnas.0702872104. ↩
- Santer, B. D., S. Soloman, F. J. Wentz, Q. Fu, S. Po-Chedley, C. Mears, J. F. Painter, and C. Bonfils, 2017: Tropospheric warming over the past two decades. Scientific Reports, 7, 2336, doi:10.1038/s41598-017-02520-7. ↩
- Santer, B. D., S. Solomon, G. Pallotta, C. Mears, S. Po-Chedley, Q. Fu, F. Wentz, C.-Z. Zou, J. Painter, I. Cvijanovic, and C. Bonfils, 2017: Comparing tropospheric warming in climate models and satellite data. Journal of Climate, 30, 373–392, doi:10.1175/JCLI-D-16-0333.1. ↩
- Sardeshmukh, P. D., G. P. Compo, and C. Penland, 2015: Need for caution in interpreting extreme weather statistics. Journal of Climate, 28, 9166–9187, doi:10.1175/JCLI-D-15-0020.1. ↩
- Schellnhuber, H. J., S. Rahmstorf, and R. Winkelmann, 2016: Why the right climate target was agreed in Paris. Nature Climate Change, 6, 649–653, doi:10.1038/nclimate3013. ↩
- Schmidt, G. A., D. T. Shindell, and K. Tsigaridis, 2014: Reconciling warming trends. Nature Geoscience, 7, 158–160, doi:10.1038/ngeo2105. ↩
- Schmidt, G. A., J. H. Jungclaus, C. M. Ammann, E. Bard, P. Braconnot, T. J. Crowley, G. Delaygue, F. Joos, N. A. Krivova, R. Muscheler, B. L. Otto-Bliesner, J. Pongratz, D. T. Shindell, S. K. Solanki, F. Steinhilber, and L. E. A. Vieira, 2011: Climate forcing reconstructions for use in PMIP simulations of the last millennium (v1.0). Geoscientific Model Development, 4, 33–45, doi:10.5194/gmd-4-33-2011. ↩
- Schurer, A. P., S. F. B. Tett, and G. C. Hegerl, 2014: Small influence of solar variability on climate over the past millennium. Nature Geoscience, 7, 104–108, doi:10.1038/ngeo2040. ↩
- Schwartz, M. D., R. Ahas, and A. Aasa, 2006: Onset of spring starting earlier across the Northern Hemisphere. Global Change Biology, 12, 343–351, doi:10.1111/j.1365-2486.2005.01097.x. ↩
- Seneviratne, S. I., M. G. Donat, B. Mueller, and L. V. Alexander, 2014: No pause in the increase of hot temperature extremes. Nature Climate Change, 4, 161–163, doi:10.1038/nclimate2145. ↩
- Seo, K.-W., C. R. Wilson, T. Scambos, B.-M. Kim, D. E. Waliser, B. Tian, B.-H. Kim, and J. Eom, 2015: Surface mass balance contributions to acceleration of Antarctic ice mass loss during 2003–2013. Journal of Geophysical Research Solid Earth, 120, 3617–3627, doi:10.1002/2014JB011755. ↩
- Sheffield, J., E. F. Wood, and M. L. Roderick, 2012: Little change in global drought over the past 60 years. Nature, 491, 435–438, doi:10.1038/nature11575. ↩
- Shiklomanov, N. E., D. A. Streletskiy, and F. E. Nelson, 2012: Northern Hemisphere component of the global Circumpolar Active Layer Monitory (CALM) program. , 377–382. URL ↩
- Sobel, A. H., S. J. Camargo, T. M. Hall, C.-Y. Lee, M. K. Tippett, and A. A. Wing, 2016: Human influence on tropical cyclone intensity. Science, 353, 242–246, doi:10.1126/science.aaf6574. ↩
- Sokolov, A. P., D. W. Kicklighter, J. M. Melillo, B. S. Felzer, C. A. Schlosser, and T. W. Cronin, 2008: Consequences of considering carbon–nitrogen interactions on the feedbacks between climate and the terrestrial carbon cycle. Journal of Climate, 21, 3776–3796, doi:10.1175/2008JCLI2038.1. ↩
- Solomon, S., K. H. Rosenlof, R. W. Portmann, J. S. Daniel, S. M. Davis, T. J. Sanford, and G.-K. Plattner, 2010: Contributions of stratospheric water vapor to decadal changes in the rate of global warming. Science, 327, 1219–1223, doi:10.1126/science.1182488. ↩
- Sousa, P. M., R. M. Trigo, P. Aizpurua, R. Nieto, L. Gimeno, and R. Garcia-Herrera, 2011: Trends and extremes of drought indices throughout the 20th century in the Mediterranean. Natural Hazards and Earth System Sciences, 11, 33–51, doi:10.5194/nhess-11-33-2011. ↩
- Steinman, B. A., M. B. Abbott, M. E. Mann, N. D. Stansell, and B. P. Finney, 2012: 1,500 year quantitative reconstruction of winter precipitation in the Pacific Northwest. Proceedings of the National Academy of Sciences, 109, 11619–11623, doi:10.1073/pnas.1201083109. ↩
- Stott, P., 2016: How climate change affects extreme weather events. Science, 352, 1517–1518, doi:10.1126/science.aaf7271. ↩
- Stroeve, J. C., M. C. Serreze, M. M. Holland, J. E. Kay, J. Malanik, and A. P. Barrett, 2012: The Arctic’s rapidly shrinking sea ice cover: A research synthesis. Climatic Change, 110, 1005–1027, doi:10.1007/s10584-011-0101-1. ↩
- Stroeve, J. C., T. Markus, L. Boisvert, J. Miller, and A. Barrett, 2014: Changes in Arctic melt season and implications for sea ice loss. Geophysical Research Letters, 41, 1216–1225, doi:10.1002/2013GL058951. ↩
- Stroeve, J. C., V. Kattsov, A. Barrett, M. Serreze, T. Pavlova, M. Holland, and W. N. Meier, 2012: Trends in Arctic sea ice extent from CMIP5, CMIP3 and observations. Geophysical Research Letters, 39, L16502, doi:10.1029/2012GL052676. ↩
- Stroeve, J., A. Barrett, M. Serreze, and A. Schweiger, 2014: Using records from submarine, aircraft and satellites to evaluate climate model simulations of Arctic sea ice thickness. The Cryosphere, 8, 1839–1854, doi:10.5194/tc-8-1839-2014. ↩
- Sweet, W. V., R. E. Kopp, C. P. Weaver, J. Obeysekera, R. M. Horton, E. R. Thieler, and C. Zervas, 2017: Global and Regional Sea Level Rise Scenarios for the United States. 75 pp., National Oceanic and Atmospheric Administration, National Ocean Service. URL ↩
- Sweet, W. V., and J. Park, 2014: From the extreme to the mean: Acceleration and tipping points of coastal inundation from sea level rise. Earth’s Future, 2, 579–600, doi:10.1002/2014EF000272. ↩
- Tedesco, M., E. Box, J. Cappelen, R. S. Fausto, X. Fettweis, K. Hansen, T. Mote, C. J. P. P. Smeets, D. V. As, R. S. W. V. de Wal, and J. Wahr, 2015: [The Arctic] Greenland ice sheet [in “State of the Climate in 2014”]. Bulletin of the American Meteorological Society, 96 (12), S137–S139, doi:10.1175/2015BAMSStateoftheClimate.1. ↩
- Tedesco, M., X. Fettweis, M. R. van den Broeke, R. S. W. van de Wal, C. J. P. P. Smeets, W. J. van de Berg, M. C. Serreze, and J. E. Box, 2011: The role of albedo and accumulation in the 2010 melting record in Greenland. Environmental Research Letters, 6, 014005, doi:10.1088/1748-9326/6/1/014005. ↩
- Tedesco, M., X. Fettweis, T. Mote, J. Wahr, P. Alexander, J. E. Box, and B. Wouters, 2013: Evidence and analysis of 2012 Greenland records from spaceborne observations, a regional climate model and reanalysis data. The Cryosphere, 7, 615–630, doi:10.5194/tc-7-615-2013. ↩
- Thornton, P. E., S. C. Doney, K. Lindsay, J. K. Moore, N. Mahowald, J. T. Randerson, I. Fung, J. F. Lamarque, J. J. Feddema, and Y. H. Lee, 2009: Carbon-nitrogen interactions regulate climate-carbon cycle feedbacks: Results from an atmosphere-ocean general circulation model. Biogeosciences, 6, 2099–2120, doi:10.5194/bg-6-2099-2009. ↩
- Trenberth, K. E., 2015: Has there been a hiatus? Science, 349, 691–692, doi:10.1126/science.aac9225. ↩
- Trenberth, K. E., and J. T. Fasullo, 2013: An apparent hiatus in global warming? Earth’s Future, 1, 19–32, doi:10.1002/2013EF000165. ↩
- Turney, C. S. M., and R. T. Jones, 2010: Does the Agulhas Current amplify global temperatures during super-interglacials? Journal of Quaternary Science, 25, 839–843, doi:10.1002/jqs.1423. ↩
- USGCRP, 2017: [National Climate Assessment] Indicators. U.S. Global Change Research Program. URL ↩
- Velicogna, I., and J. Wahr, 2013: Time-variable gravity observations of ice sheet mass balance: Precision and limitations of the GRACE satellite data. Geophysical Research Letters, 40, 3055–3063, doi:10.1002/grl.50527. ↩
- Vihma, T., J. Screen, M. Tjernström, B. Newton, X. Zhang, V. Popova, C. Deser, M. Holland, and T. Prowse, 2016: The atmospheric role in the Arctic water cycle: A review on processes, past and future changes, and their impacts. Journal of Geophysical Research Biogeosciences, 121, 586–620, doi:10.1002/2015JG003132. ↩
- Vose, R. S., D. Arndt, V. F. Banzon, D. R. Easterling, B. Gleason, B. Huang, E. Kearns, J. H. Lawrimore, M. J. Menne, T. C. Peterson, R. W. Reynolds, T. M. Smith, C. N. Williams, and D. L. Wuertz, 2012: NOAA’s Merged Land-Ocean Surface Temperature Analysis. Bulletin of the American Meteorological Society, 93, 1677–1685, doi:10.1175/BAMS-D-11-00241.1. ↩
- Walsh, J. E., J. E. Overland, P. Y. Groisman, and B. Rudolf, 2011: Ongoing climate change in the Arctic. Ambio, 40, 6–16, doi:10.1007/s13280-011-0211-z. ↩
- Walsh, J. et al., 2014: Ch. 2: Our Changing Climate. J.M. Melillo, T. (T. C.. Richmond, and G.W. Yohe, Eds., U.S. Global Change Research Program, 19–67. ↩
- Wang, C., L. Zhang, S.-K. Lee, L. Wu, and C. R. Mechoso, 2014: A global perspective on CMIP5 climate model biases. Nature Climate Change, 4, 201–205, doi:10.1038/nclimate2118. ↩
- Willett, K. M., D. J. Philip, W. T. Peter, and P. G. Nathan, 2010: A comparison of large scale changes in surface humidity over land in observations and CMIP3 general circulation models. Environmental Research Letters, 5, 025210, doi:10.1088/1748-9326/5/2/025210. ↩
- Williams, S. D. P., P. Moore, M. A. King, and P. L. Whitehouse, 2014: Revisiting GRACE Antarctic ice mass trends and accelerations considering autocorrelation. Earth and Planetary Science Letters, 385, 12–21, doi:10.1016/j.epsl.2013.10.016. ↩
- Zaehle, S., P. Friedlingstein, and A. D. Friend, 2010: Terrestrial nitrogen feedbacks may accelerate future climate change. Geophysical Research Letters, 37, L01401, doi:10.1029/2009GL041345. ↩
- Zaehle, S., and A. D. Friend, 2010: Carbon and nitrogen cycle dynamics in the O-CN land surface model: 1. Model description, site-scale evaluation, and sensitivity to parameter estimates. Global Biogeochemical Cycles, 24, GB1005, doi:10.1029/2009GB003521. ↩
- Zemp, M. et al., 2015: Historically unprecedented global glacier decline in the early 21st century. Journal of Glaciology, 61, 745–762, doi:10.3189/2015JoG15J017. ↩
- Zhang, R., and T. R. Knutson, 2013: The role of global climate change in the extreme low summer Arctic sea ice extent in 2012 [in “Explaining Extreme Events of 2012 from a Climate Perspective”]. Bulletin of the American Meteorological Society, 94 (9), S23–S26, doi:10.1175/BAMS-D-13-00085.1. ↩
- Zhang, X., F. W. Zwiers, G. C. Hegerl, F. H. Lambert, N. P. Gillett, S. Solomon, P. A. Stott, and T. Nozawa, 2007: Detection of human influence on twentieth-century precipitation trends. Nature, 448, 461–465, doi:10.1038/nature06025. ↩
- Zhang, X., H. Wan, F. W. Zwiers, G. C. Hegerl, and S.-K. Min, 2013: Attributing intensification of precipitation extremes to human influence. Geophysical Research Letters, 40, 5252–5257, doi:10.1002/grl.51010. ↩
- Zhu, Z. et al., 2016: Greening of the Earth and its drivers. Nature Climate Change, 6, 791–795, doi:10.1038/nclimate3004. ↩
- Zunz, V., H. Goosse, and F. Massonnet, 2013: How does internal variability influence the ability of CMIP5 models to reproduce the recent trend in Southern Ocean sea ice extent? The Cryosphere, 7, 451–468, doi:10.5194/tc-7-451-2013. ↩
- de Noblet-Ducoudré, N., J.-P. Boisier, A. Pitman, G. B. Bonan, V. Brovkin, F. Cruz, C. Delire, V. Gayler, B. J. J. M. van den Hurk, P. J. Lawrence, M. K. van der Molen, C. Müller, C. H. Reick, B. J. Strengers, and A. Voldoire, 2012: Determining robust impacts of land-use-induced land cover changes on surface climate over North America and Eurasia: Results from the first set of LUCID experiments. Journal of Climate, 25, 3261–3281, doi:10.1175/JCLI-D-11-00338.1. ↩
- van der Werf, G. R., J. T. Randerson, L. Giglio, G. J. Collatz, M. Mu, P. S. Kasibhatla, D. C. Morton, R. S. DeFries, Y. Jin, and T. T. van Leeuwen, 2010: Global fire emissions and the contribution of deforestation, savanna, forest, agricultural, and peat fires (1997–2009). Atmospheric Chemistry and Physics, 10, 11707–11735, doi:10.5194/acp-10-11707-2010. ↩