8.1: Drought
The word “drought” brings to mind abnormally dry conditions. However, the meaning of “dry” can be ambiguous and lead to confusion in how drought is actually defined. Three different classes of droughts are defined by NOAA and describe a useful hierarchal set of water deficit characterization, each with different impacts. “Meteorological drought” describes conditions of precipitation deficit. “Agricultural drought” describes conditions of soil moisture deficit. “Hydrological drought” describes conditions of deficit in runoff.1 Clearly these three characterizations of drought are related but are also different descriptions of water shortages with different target audiences and different time scales. In particular, agricultural drought is of concern to producers of food while hydrological drought is of concern to water system managers. Soil moisture is a function of both precipitation and evapotranspiration. Because potential evapotranspiration increases with temperature, anthropogenic climate change generally results in drier soils and often less runoff in the long term. In fact, under the higher scenario (RCP8.5; see Ch. 4: Projections for a description of the RCP scenarios) at the end of the 21st century, no region of the planet is projected to experience significantly higher levels of annual average surface soil moisture due to the sensitivity of evapotranspiration to temperature, even though much higher precipitation is projected in some regions.2 Seasonal and annual total runoff, on the other hand, are projected to either increase or decrease, depending on location and season under the same conditions,2 illustrating the complex relationships between the various components of the hydrological system. Meteorological drought can occur on a range of time scales, in addition to seasonal or annual time scales. “Flash droughts” can result from just a few weeks of dry weather,3 and the paleoclimate record contains droughts of several decades. Hence, it is vital to describe precisely the definition of drought in any public discussion to avoid confusion due to this complexity. As the climate changes, conditions currently considered “abnormally” dry may become relatively “normal” in those regions undergoing aridification, or extremely unlikely in those regions becoming wetter. Hence, the reference conditions defining drought may need to be modified from those currently in practice.
8.1.1 Historical Context
The United States has experienced all three types of droughts in the past, always driven, at least in some part, by natural variations in seasonal and/or annual precipitation amounts. As the climate changes, we can expect that human activities will alter the effect of these natural variations. The “Dust Bowl” drought of the 1930s is still the most significant meteorological and agricultural drought experienced in the United States in terms of its geographic and temporal extent. However, even though it happened prior to most of the current global warming, human activities exacerbated the dryness of the soil by the farming practices of the time.4 Tree ring archives reveal that such droughts (in the agricultural sense) have occurred occasionally over the last 1,000 years.5 Climate model simulations suggest that droughts lasting several years to decades occur naturally in the southwestern United States.6 The Intergovernmental Panel on Climate Change Fifth Assessment Report (IPCC AR5)7 concluded “there is low confidence in detection and attribution of changes in (meteorological) drought over global land areas since the mid-20th century, owing to observational uncertainties and difficulties in distinguishing decadal-scale variability in drought from long-term trends.” As they noted, this was a weaker attribution statement than in the Fourth Assessment Report,8 which had concluded “that an increased risk of drought was more likely than not due to anthropogenic forcing during the second half of the 20th century.” The weaker statement in AR5 reflected additional studies with conflicting conclusions on global drought trends (e.g., Sheffield et al. 2012;9 Dai 201310 ). Western North America was noted as a region where determining if observed recent droughts were unusual compared to natural variability was particularly difficult. This was due to evidence from paleoclimate proxies of cases of central U.S. droughts during the past 1,000 years that were longer and more intense than historical U.S. droughts.11 Drought is, of course, directly connected to seasonal precipitation totals. Figure 7.1 shows detectable observed recent changes in seasonal precipitation. In fact, the increases in observed summer and fall precipitation are at odds with the projections in Figure 7.5. As a consequence of this increased precipitation, drought statistics over the entire CONUS have declined.3 ,12 Furthermore, there is no detectable change in meteorological drought at the global scale.9 However, a number of individual event attribution studies suggest that if a drought occurs, anthropogenic temperature increases can exacerbate soil moisture deficits (e.g., Seager et al. 2015;13 Trenberth et al. 201414 ). Future projections of the anthropogenic contribution to changes in drought risk and severity must be considered in the context of the significant role of natural variability.
8.1.2 Recent Major U.S. Droughts
METEOROLOGICAL AND AGRICULTURAL DROUGHT
The United States has suffered a number of very significant droughts of all types since 2011. Each of these droughts was a result of different persistent, large-scale meteorological patterns of mostly natural origins, with varying degrees of attributable human influence. Table 8.1 summarizes available attribution statements for recent extreme U.S. droughts. Statements about meteorological drought are decidedly mixed, revealing the complexities in interpreting the low tail of the distribution of precipitation. Statements about agricultural drought consistently maintain a human influence if only surface soil moisture measures are considered. The single agricultural drought attribution study at root depth comes to the opposite conclusion.15 In all cases, these attribution statements are examples of attribution without detection (see Appendix C). The absence of moisture during the 2011 Texas/Oklahoma drought and heat wave was found to be an event whose likelihood was enhanced by the La Niña state of the ocean, but the human interference in the climate system still doubled the chances of reaching such high temperatures.16 This study illustrates that the effect of human-induced climate change is combined with natural variations and can compound or inhibit the realized severity of any given extreme weather event.
| Authors | Event Year and Duration | Region or State | Type | Attribution Statement |
|---|---|---|---|---|
| Rupp et al. 2012130 / Angélil et al. 201718 | MAMJJA 2011 | Texas | Meteorological | +/+ |
| Hoerling et al. 201316 | 2012 | Texas | Meteorological | + |
| Rupp et al. 201319 / Angélil et al. 201718 | MAMJJA 2012 | CO, NE, KS, OK, IA, MO, AR & IL | Meteorological | 0/0 |
| Rupp et al. 201319 / Angélil et al. 201718 | MAM 2012 | CO, NE, KS, OK, IA, MO, AR & IL | Meteorological | 0/0 |
| Rupp et al. 201319 / Angélil et al. 201718 | JJA 2012 | CO, NE, KS, OK, IA, MO, AR & IL | Meteorological | 0/+ |
| Hoerling et al. 201417 | MJJA 2012 | Great Plains/Midwest | Meteorological | 0 |
| Swain et al. 201424 / Angélil et al. 201718 | ANN 2013 | California | Meteorological | +/+ |
| Wang and Schubert 201429 / Angélil et al. 201718 | JS 2013 | California | Meteorological | 0/+ |
| Knutson et al. 2014131 / Angélil et al. 201718 | ANN 2013 | California | Meteorological | 0/+ |
| Knutson et al. 2014131 / Angélil et al. 201718 | MAM 2013 | U.S. Southern Plains region | Meteorological | 0/+ |
| Diffenbaugh et al. 201528 | 2012-2014 | California | Agricultural | + |
| Seager et al. 201513 | 2012-2014 | California | Agricultural | + |
| Cheng et al. 201615 | 2011-2015 | California | Agricultural | − |
| Mote et al. 201631 | 2015 | Washington, Oregon, California | Hydrological (snow water equivalent) | + |
The Great Plains/Midwest drought of 2012 was the most severe summer meteorological drought in the observational record for that region.17 An unfortunate string of three different patterns of large-scale meteorology from May through August 2012 precluded the normal frequency of summer thunderstorms and was not predicted by the NOAA seasonal forecasts.17 Little influence of the global sea surface temperature (SST) pattern on meteorological drought frequency has been found in model simulations.17 No evidence of a human contribution to the 2012 precipitation deficit in the Great Plains and Midwest is found in numerous studies.17 ,18 ,19 However, an alternative view is that the 2012 central U.S. drought can be classified as a “heat wave flash drought”,20 a type of rapidly evolving drought that has decreased in frequency over the past century.3 Also, an increase in the chances of the unusually high temperatures seen in the United States in 2012, partly associated with resultant dry summer soil moisture anomalies, was attributed to the human interference with the climate system,21 indicating the strong feedback between lower soil moisture and higher surface air temperatures during periods of low precipitation. One study found that most, but not all, of the 2012 surface moisture deficit in the Great Plains was attributable to the precipitation deficit.22 That study also noted that Great Plains root depth and deeper soil moisture was higher than normal in 2012 despite the surface drying, due to wet conditions in prior years, indicating the long time scales relevant below the surface.22
The recent California drought, which began in 2011, is unusual in different respects. In this case, the precipitation deficit from 2011 to 2014 was a result of the “ridiculously resilient ridge” of high pressure. This very stable high pressure system steered storms towards the north, away from the highly engineered California water resource system.13 ,23 ,24 A slow-moving high sea surface temperature (SST) anomaly, referred to as “The Blob”— was caused by a persistent ridge that weakened the normal cooling mechanisms for that region of the upper ocean.25 Atmospheric modeling studies showed that the ridge that caused The Blob was favored by a pattern of persistent tropical SST anomalies that were warm in the western equatorial Pacific and simultaneously cool in the far eastern equatorial Pacific.23 ,26 It was also favored by reduced arctic sea ice and from feedbacks with The Blob’s SST anomalies.27 These studies also suggest that internal variability likely played a prominent role in the persistence of the 2013–2014 ridge off the west coast of North America. Observational records are not long enough and the anomaly was unusual enough that similarly long-lived patterns have not been often seen before. Hence, attribution statements, such as that about an increasing anthropogenic influence on the frequency of geopotential height anomalies similar to 2012–2014 (e.g., Swain et al. 201424 ), are without associated detection (Ch. 3: Detection and Attribution). A secondary attribution question concerns the anthropogenic precipitation response in the presence of this SST anomaly. In attribution studies with a prescribed 2013 SST anomaly, a consistent increase in the human influence on the chances of very dry California conditions was found.18
Anthropogenic climate change did increase the risk of the high temperatures in California in the winters of 2013–2014 and 2014–2015, especially the latter,13 ,28 ,29 further exacerbating the soil moisture deficit and the associated stress on irrigation systems. This raises the question, as yet unanswered, of whether droughts in the western United States are shifting from precipitation control30 to temperature control. There is some evidence to support a relationship between mild winter and/or warm spring temperatures and drought occurrence,31 but long-term warming trends in the tropical and North Pacific do not appear to have led to trends toward less precipitation over California.32 An anthropogenic contribution to commonly used measures of agricultural drought, including the Palmer Drought Severity Index (PDSI), was found in California28 ,33 and is consistent with previous projections of changes in PDSI10 ,34 ,35 and with an attribution study.36 Due to its simplicity, the PDSI has been criticized as being overly sensitive to higher temperatures and thus may exaggerate the human contribution to soil dryness.37 In fact, this study also finds that formulations of potential evaporation used in more complicated hydrologic models are similarly biased, undermining confidence in the magnitude but not the sign of projected surface soil moisture changes in a warmer climate. Seager et al.13 analyzed climate model output directly, finding that precipitation minus evaporation in the southwestern United States is projected to experience significant decreases in surface water availability, leading to surface runoff decreases in California, Nevada, Texas, and the Colorado River headwaters even in the near term. However, the criticisms of PDSI also apply to most of the CMIP5 land surface model evapotranspiration formulations. Analysis of soil moisture in the CMIP5 models at deeper levels is complicated by the wide variety in sophistication of their component land models. A pair of studies reveals less sensitivity at depth-to-surface air temperature increases than at near-surface levels.15 ,38 Berg et al.39 adjust for the differences in land component model vertical treatments, finding projected change in vertically integrated soil moisture down to 3 meters depth is mixed, with projected decreases in the Southwest and in the south-central United States, but increases over the northern plains. Nonetheless, the warming trend has led to declines in a number of indicators, including Sierra snow water equivalent, that are relevant to hydrological drought.30 Attribution of the California drought and heat wave remains an interesting and controversial research topic.
In summary, there has not yet been a formal identification of a human influence on past changes in United States meteorological drought through the analysis of precipitation trends. Some, but not all, U.S. meteorological drought event attribution studies, largely in the “without detection” class, exhibit a human influence. Attribution of a human influence on past changes in U.S. agricultural drought are limited both by availability of soil moisture observations and a lack of subsurface modeling studies. While a human influence on surface soil moisture trends has been identified with medium confidence, its relevance to agriculture may be exaggerated.
RUNOFF AND HYDROLOGICAL DROUGHT
Several studies focused on the Colorado River basin in the United States that used more sophisticated runoff models driven by the CMIP3 models40 ,41 ,42 ,43 ,44 showed that annual runoff reductions in a warmer western Unites States climate occur through a combination of evapotranspiration increases and precipitation decreases, with the overall reduction in river flow exacerbated by human water demands on the basin’s supply. Reduced U.S. snowfall accumulations in much warmer future climates are virtually certain as frozen precipitation is replaced by rain regardless of the projected changes in total precipitation amounts discussed in Chapter 7: Precipitation Change (Figure 7.6). The profound change in the hydrology of snowmelt-driven flows in the western United States is well documented. Earlier spring runoff45 reduced the fraction of precipitation falling as snow46 and the snowpack water content at the end of winter,47 ,48 consistent with warmer temperatures. Formal detection and attribution (Ch. 3: Detection and Attribution) of the observed shift towards earlier snowmelt-driven flows in the western United States reveals that the shift is detectably different from natural variability and attributable to anthropogenic climate change.49 Similarly, observed declines in the snow water equivalent in the region have been formally attributed to anthropogenic climate change50 as have temperature, river flow, and snowpack.41 ,51 As a harbinger, the unusually low western U.S. snowpack of 2015 may become the norm.31
In the northwestern United States, long-term trends in streamflow have seen declines, with the strongest trends in drought years52 that are attributed to a decline in winter precipitation.53 These reductions in precipitation are linked to decreased westerly wind speeds in winter over the region. Furthermore, the trends in westerlies are consistent with CMIP5-projected wind speed changes due to a decreasing meridional temperature and pressure gradients rather than low-frequency climate variability modes. Such precipitation changes have been a primary source of change in hydrological drought in the Northwest over the last 60 years54 and are in addition to changes in snowpack properties.
We conclude with high confidence that these observed changes in temperature controlled aspects of western U.S. hydrology are likely a consequence of human changes to the climate system.
8.1.3 Projections of Future Droughts
The future changes in seasonal precipitation shown in Chapter 7: Precipitation Change (Figure 7.6) indicate that the southwestern United States may experience chronic future precipitation deficits, particularly in the spring. In much warmer climates, expansion of the tropics and subtropics, traceable to changes in the Hadley circulation, cause shifts in seasonal precipitation that are particularly evident in such arid and semi-arid regions and increase the risk of meteorological drought. However, uncertainty in the magnitude and timing of future southwestern drying is high. We note that the weighted and downscaled projections of Figure 7.6 exhibit significantly less drying and are assessed to be less significant in comparison to natural variations than the original unweighted CMIP5 projections.34
Western U.S. hydrological drought is currently controlled by the frequency and intensity of extreme precipitation events, particularly atmospheric rivers, as these events represent the source of nearly half of the annual water supply and snowpack for the western coastal states.55 ,56 Climate projections indicate greater frequency of atmospheric rivers in the future (e.g., Dettinger 2011;55 Warner et al. 2015;57 Gao et al. 2015;58 see further discussion in Ch. 9: Extreme Storms). Sequences of these extreme storms have played a critical role in ending recent hydrological droughts along the U.S. West Coast.59 However, as winter temperatures increase, the fraction of precipitation falling as snow will decrease, potentially disrupting western U.S. water management practices.
Significant U.S. seasonal precipitation deficits are not confidently projected outside of the Southwest. However, future higher temperatures will likely lead to greater frequencies and magnitudes of agricultural droughts throughout the continental United States as the resulting increases in evapotranspiration outpace projected precipitation increases.2 Figure 8.1 shows the weighted multimodel projection of the percent change in near-surface soil moisture at the end of the 21st century under the higher scenario (RCP8.5), indicating widespread drying over the entire continental United States. Previous National Climate Assessments34 ,60 have discussed the implication of these future drier conditions in the context of the PDSI, finding that the future normal condition would be considered drought at the present time, and that the incidence of “extreme drought” (PDSI < −4) would be significantly increased. However, as described below, the PDSI may overestimate future soil moisture drying.
This projection is made “without attribution” (Ch. 4: Projections), but confidence that future soils will generally be drier at the surface is medium, as the mechanisms leading to increased evapotranspiration in a warmer climate are elementary scientific facts. However, the land surface component models in the CMIP5 climate models vary greatly in their sophistication, causing the projected magnitude of both the average soil moisture decrease and the increased risk for agricultural drought to be less certain. The weighted projected seasonal decreases in surface soil moisture are generally towards drier conditions, even in regions and seasons where precipitation is projected to experience large increases (Figure 7.6) due to increases in the evapotranspiration associated with higher temperature. Drying is assessed to be large relative to natural variations in much of the CONUS region in the summer. Significant spring and fall drying is also projected in the mountainous western states, with potential implications for forest and wildfire risk. Also, the combination of significant summer and fall drying in the midwestern states has potential agricultural implications. The largest percent changes are projected in the southwestern United States and are consistent in magnitude with an earlier study of the Colorado River Basin using more sophisticated macroscale hydrological models.42
In this assessment, we limit the direct CMIP5 weighted multimodel projection of soil moisture shown in Figure 8.1 to the surface (defined as the top 10 cm of the soil), as the land surface component sub-models vary greatly in their representation of the total depth of the soil. A more relevant projection to agricultural drought would be the soil moisture at the root depth of typical U.S. crops. Cook et al.38 find that future drying at a depth of 30 cm will be less than at 2 cm, but still significant and comparable to a modified PDSI formulation. Few of the CMIP5 land models have detailed ecological representations of evapotranspiration processes, causing the simulation of the soil moisture budget to be less constrained than reality.61 Over the western United States, unrealistically low elevations in the CMIP5 models due to resolution constraints present a further challenge in interpreting evapotranspiration changes. Nonetheless, Figure 8.1 shows a projected drying of surface soil moisture across nearly all of the coterminous United States in all seasons, even in regions and seasons where precipitation is projected to increase, consistent with increased evapotranspiration due to elevated temperatures.38
Figure 8.1
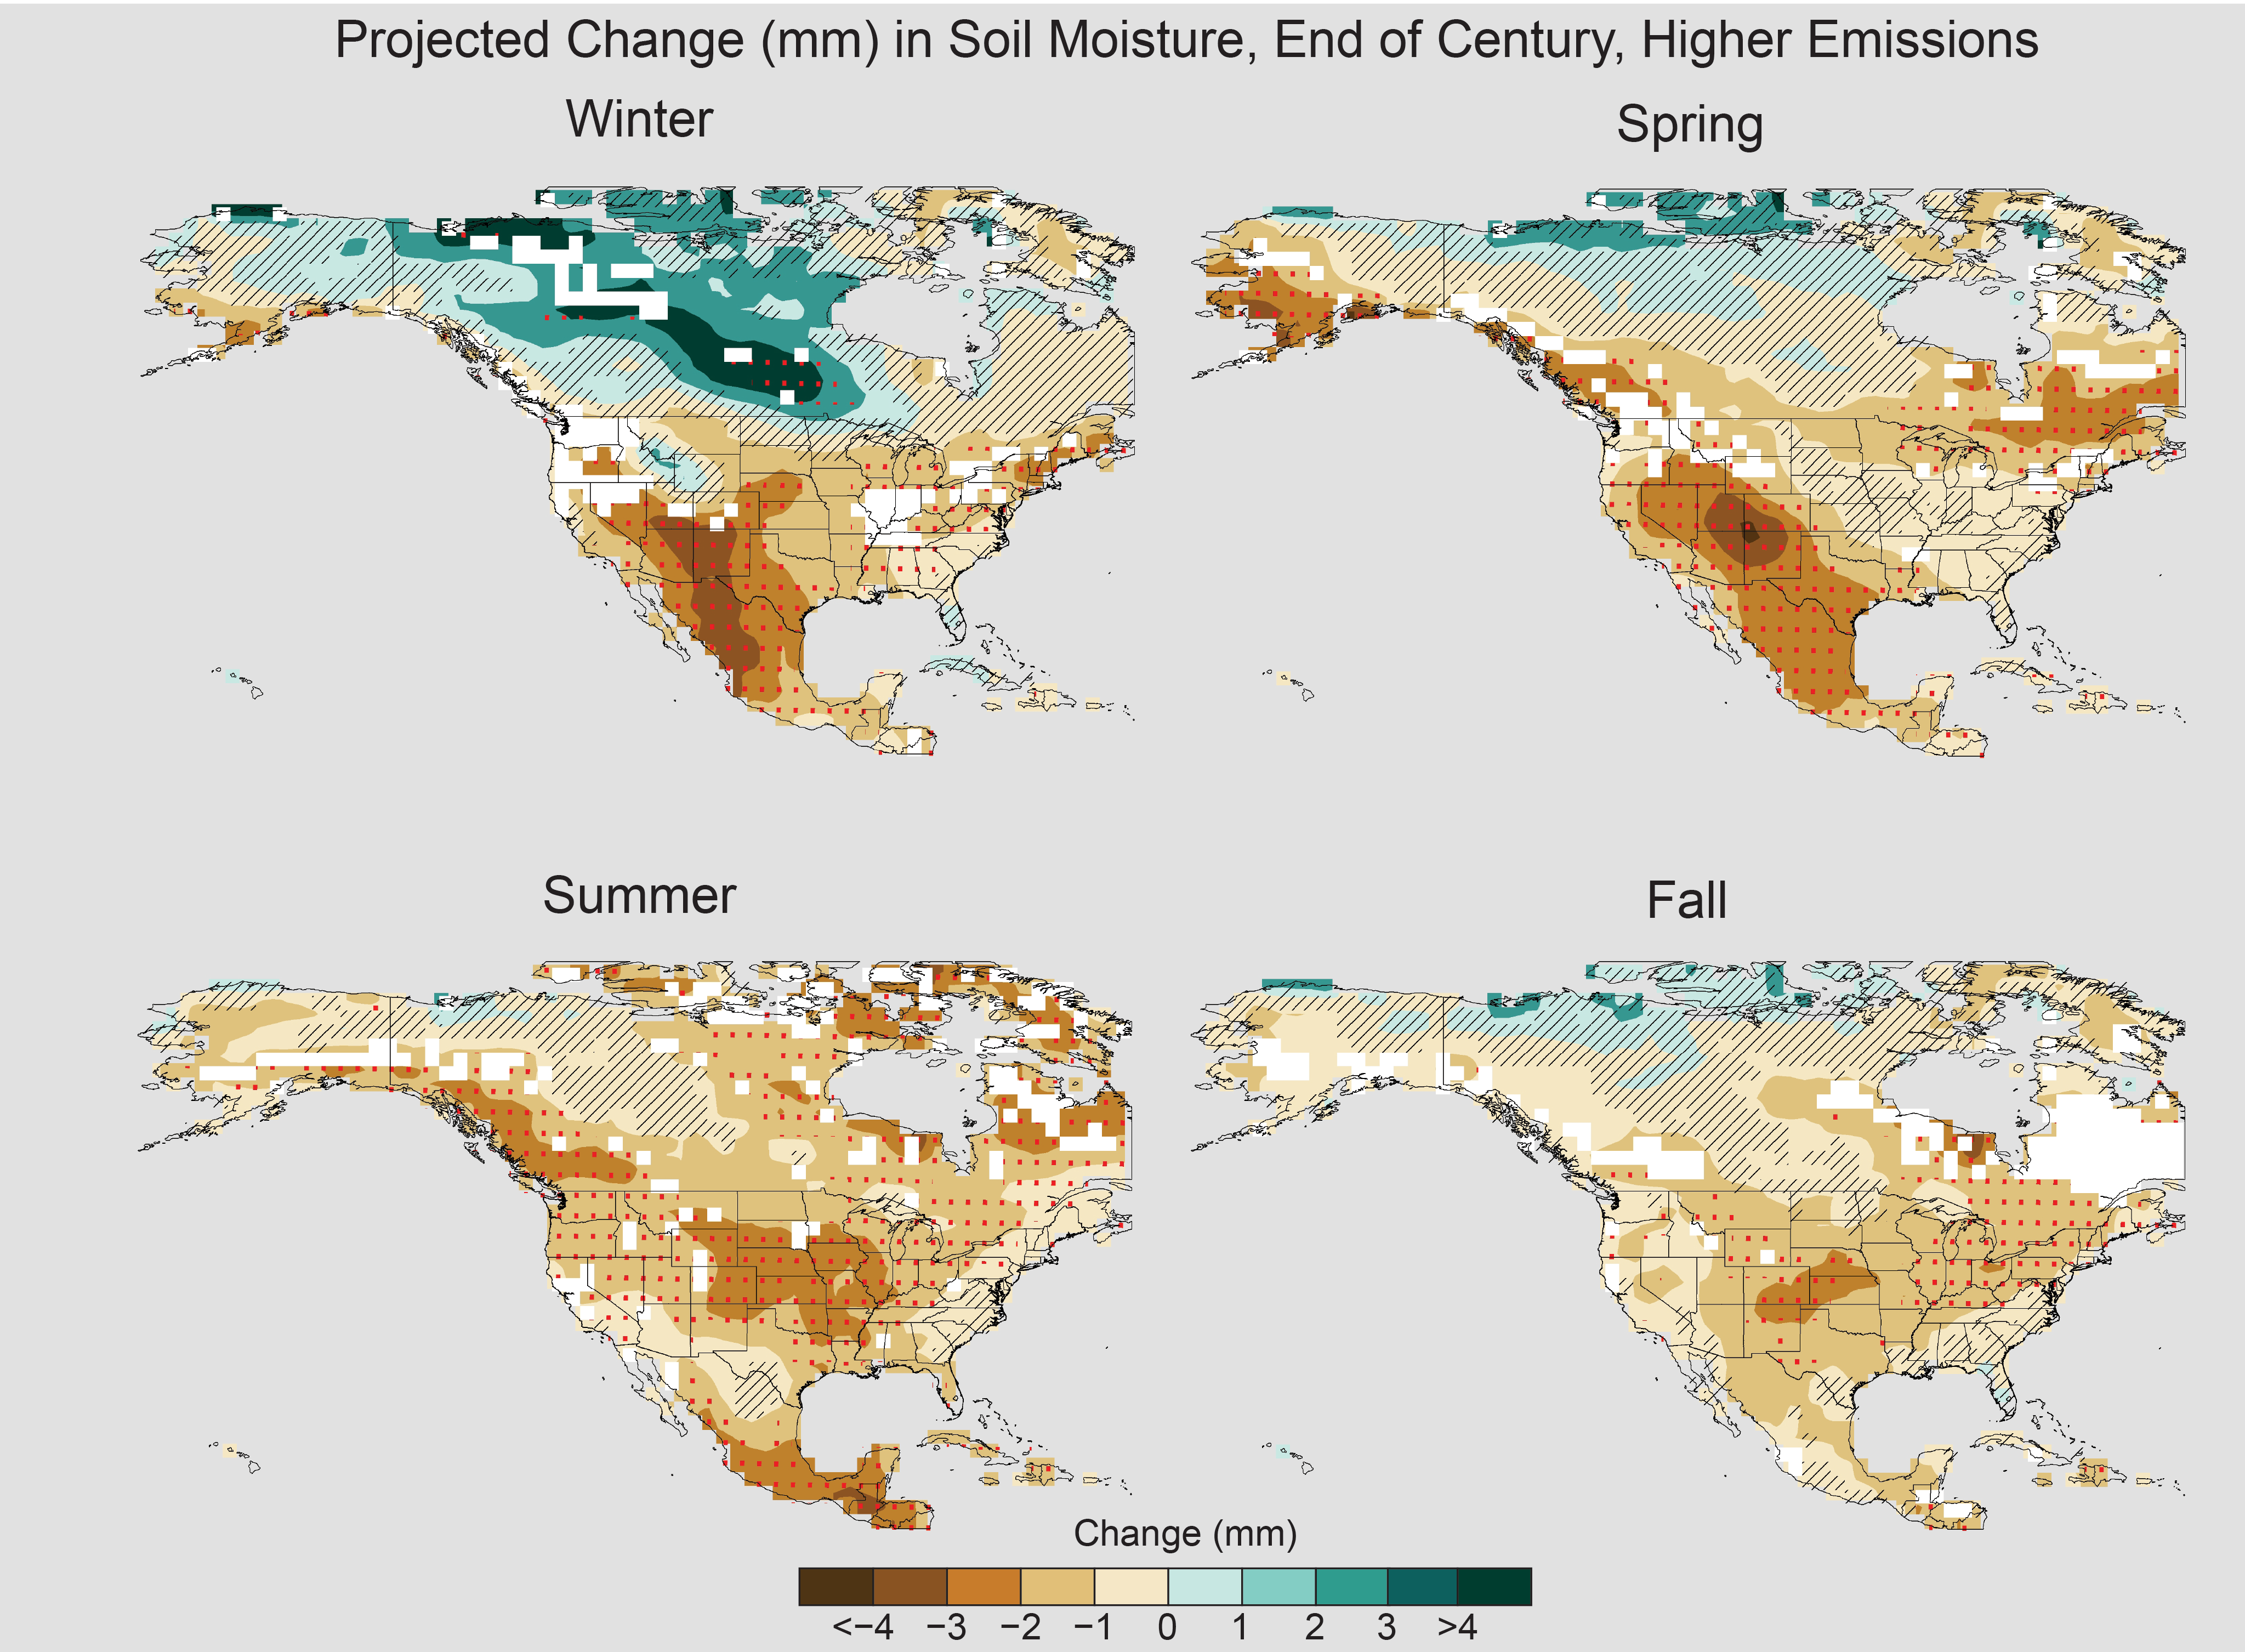
Projected end of the 21st century weighted CMIP5 multimodel average percent changes in near surface seasonal soil moisture (mrsos) under the higher scenario (RCP8.5). Stippling indicates that changes are assessed to be large compared to natural variations. Hashing indicates that changes are assessed to be small compared to natural variations. Blank regions (if any) are where projections are assessed to be inconclusive (Appendix B). (Figure source: NOAA NCEI and CICS-NC).
Widespread reductions in mean snowfall across North America are projected by the CMIP5 models.62 Together with earlier snowmelt at altitudes high enough for snow, disruptions in western U.S. water delivery systems are expected to lead to more frequent hydrological drought conditions.40 ,41 ,50 ,63 ,64 Due to resolution constraints, the elevation of mountains as represented in the CMIP5 models is too low to adequately represent the effects of future temperature on snowpacks. However, increased model resolution has been demonstrated to have important impacts on future projections of snowpack water content in warmer climates and is enabled by recent advances in high performance computing.65 Figure 8.2 and Table 8.2 show a projection of changes in western U.S. mountain winter (December, January, and February) hydrology obtained from a different high-resolution atmospheric model at the middle and end of the 21st century under the higher scenario (RCP8.5). These projections indicate dramatic reductions in all aspects of snow66 and are similar to previous statistically downscaled projections.67 ,68 Table 8.2 reveals that the reductions in snow water equivalent accelerate in the latter half of this century under the higher scenario (RCP8.5) and with substantial variations across the western United States. Changes in snow residence time, an alternative measure of snowpack relevant to the timing of runoff, is also shown to be sensitive to elevation, with widespread reductions across this region.69 Given the larger projected increases in temperature at high altitudes compared to adjacent lower altitudes70 and the resulting changes in both snowpack depth and melt timing in very warm future scenarios such as RCP8.5, and assuming no change to water resource management practices, several important western U.S. snowpack reservoirs effectively disappear by 2100 in this dynamical projection, resulting in chronic, long-lasting hydrological drought. This dramatic statement is also supported by two climate model studies: a multimodel statistical downscaling of the CMIP5 RCP8.5 ensemble that finds large areal reductions in snow-dominated regions of the western United States by mid-century and complete elimination of snow-dominated regions in certain watersheds,68 and a large ensemble simulation of a global climate model.71
| Mountain Range | Snow Water Equivalent (% Change) |
Snow Cover (% Change) |
Snowfall (% Change) |
Surface Temperature (Change in K) |
||||
|---|---|---|---|---|---|---|---|---|
| 2050 | 2100 | 2050 | 2100 | 2050 | 2100 | 2050 | 2100 | |
| Cascandes | -41.5 | -89.9 | -21.6 | -72.9 | -10.7 | -50.0 | 0.9 | 4.1 |
| Klamath | -50.7 | -95.8 | -38.6 | -89.0 | -23.1 | -78.7 | 0.8 | 3.5 |
| Rockies | -17.3 | -65.1 | -8.2 | -43.1 | 1.7 | -8.2 | 1.1 | 4.5 |
| Sierra Nevada | -21.8 | -89.0 | -21.9 | -77.7 | -4.7 | -66.6 | 1.1 | 4.5 |
| Wasatch and Uinta | -18.9 | -78.7 | -14.2 | -61.4 | 4.1 | -34.6 | 1.8 | 6.1 |
| Western USA | -22.3 | -70.1 | -12.7 | -51.5 | -1.6 | -21.4 | 1.3 | 5.2 |
As earlier spring melt and reduced snow water equivalent have been formally attributed to human-induced warming, substantial reductions in western U.S. winter and spring snowpack are projected (with attribution) to be very likely as the climate continues to warm (very high confidence). Under higher scenarios and assuming no change to current water-resources management, chronic, long-duration hydrological drought is increasingly possible by the end of this century (very high confidence).
Figure 8.2
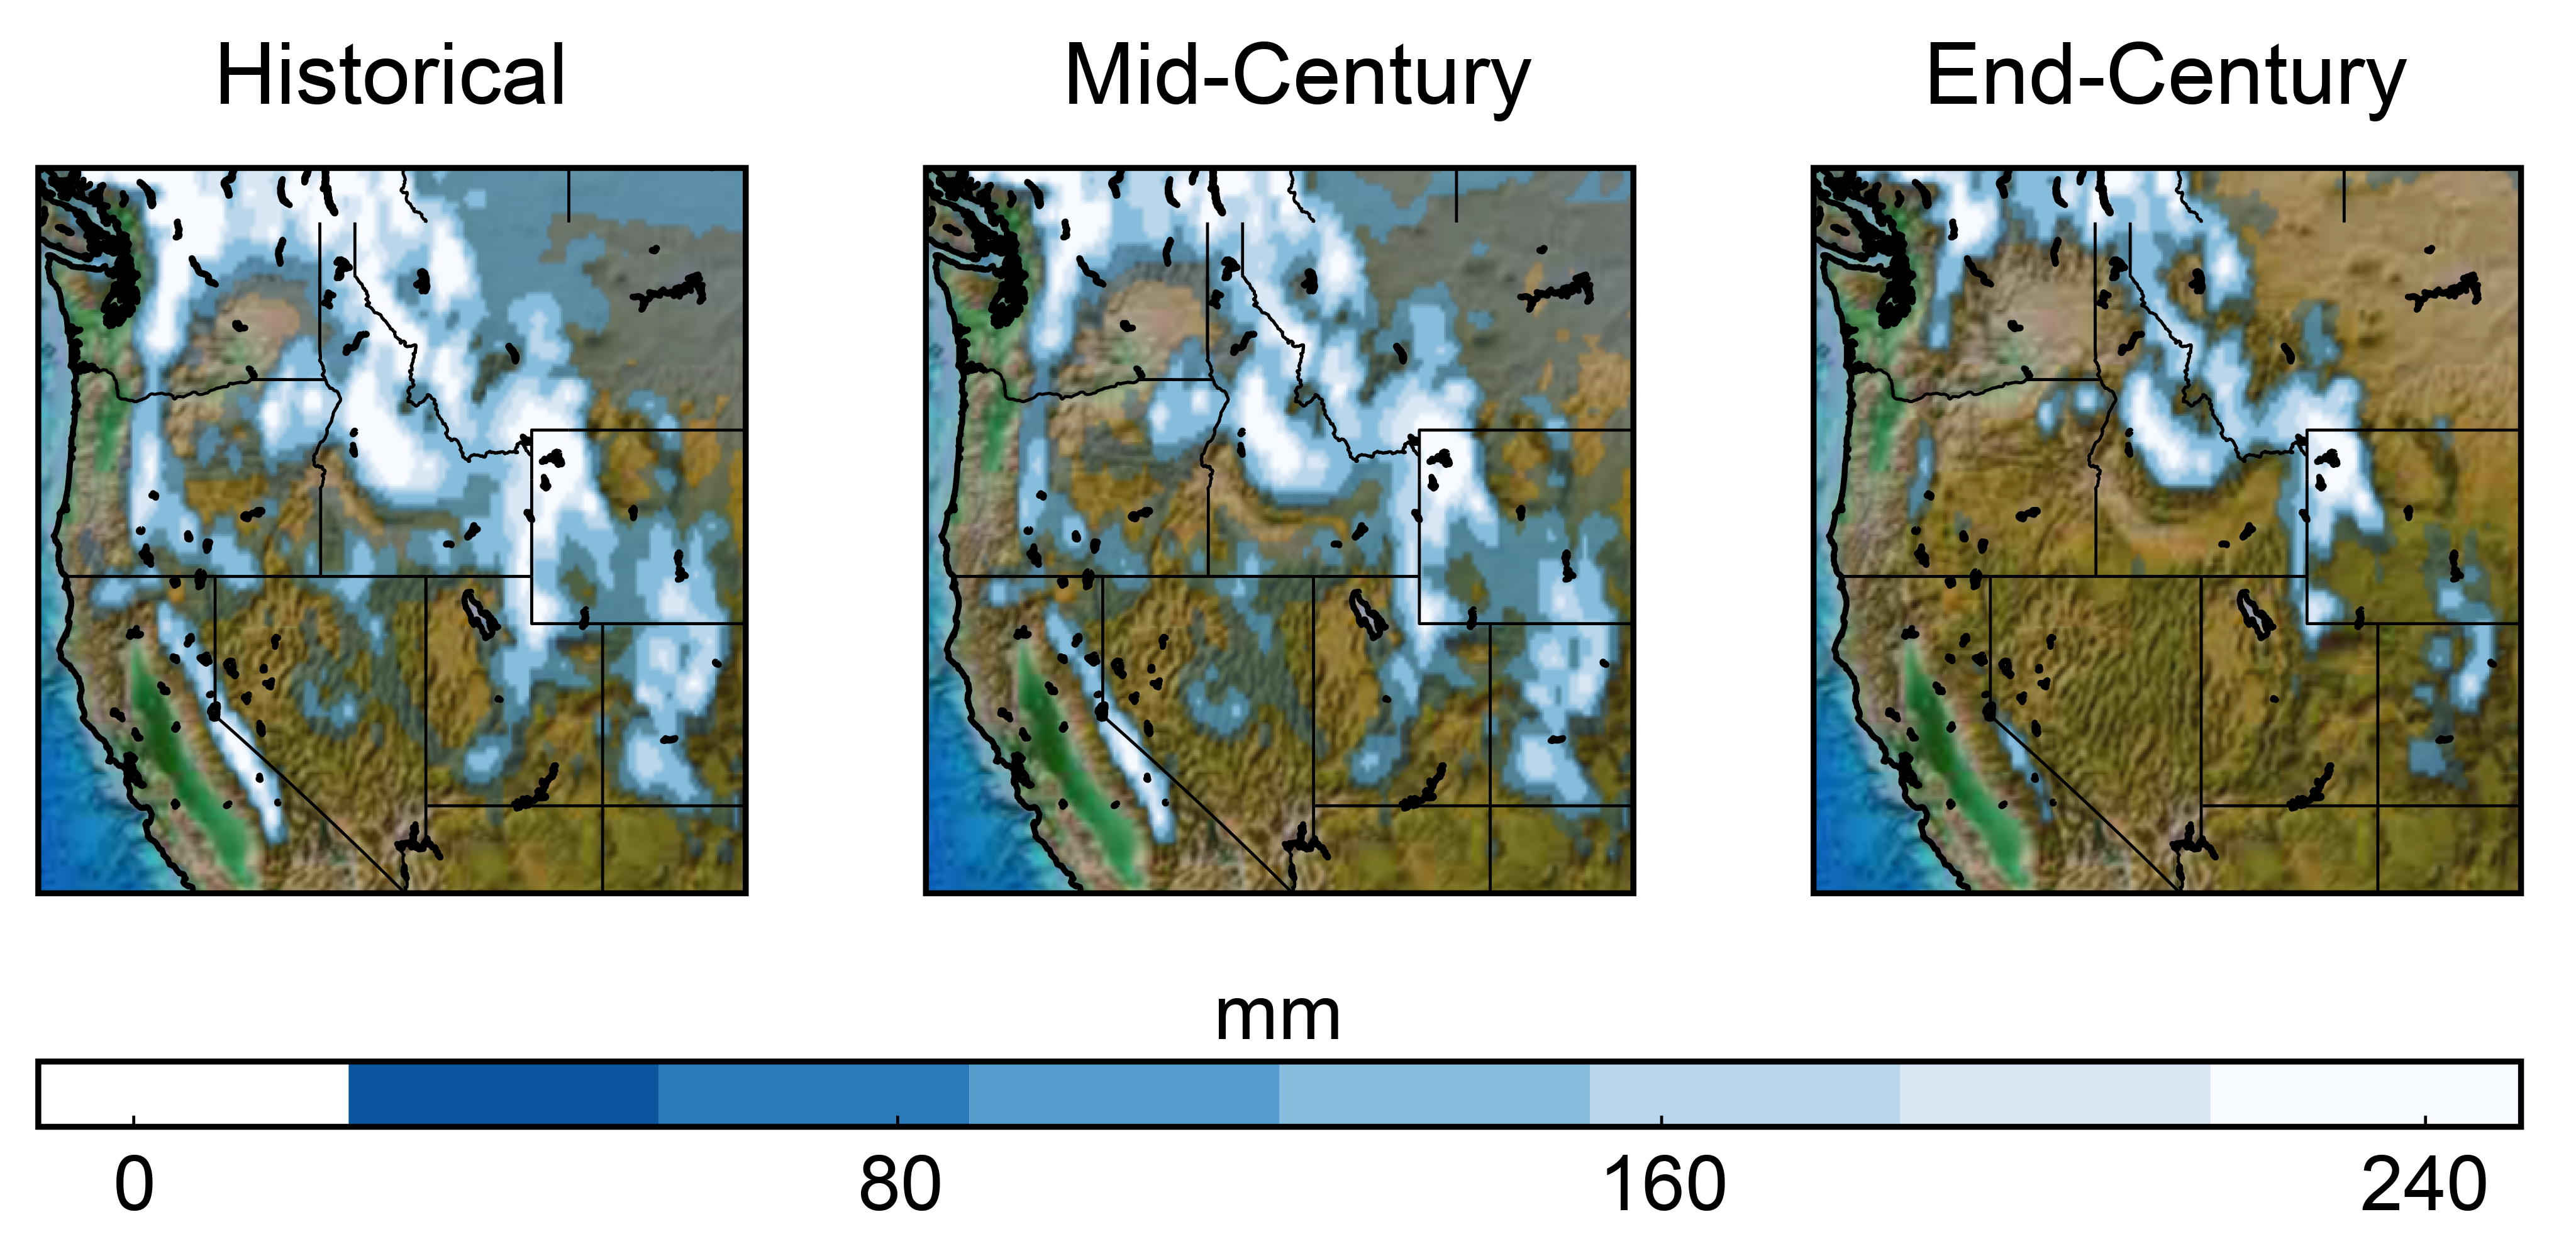
Projected changes in winter (DJF) snow water equivalent at the middle and end of this century under the higher scenario (RCP8.5) from a high-resolution version of the Community Atmospheric Model, CAM5.66 (Figure source: H. Krishnan, LBNL).
8.2: Floods
Flooding damage in the United States can come from flash floods of smaller rivers and creeks, prolonged flooding along major rivers, urban flooding unassociated with proximity to a riverway, coastal flooding from storm surge which may be exacerbated by sea level rise, and the confluence of coastal storms and inland riverine flooding from the same precipitation event (Ch. 12: Sea Level Rise). Flash flooding is associated with extreme precipitation somewhere along the river which may occur upstream of the regions at risk. Flooding of major rivers in the United States with substantial winter snow accumulations usually occurs in the late winter or spring and can result from an unusually heavy seasonal snowfall followed by a “rain on snow” event or from a rapid onset of higher temperatures that leads to rapid snow melting within the river basin. In the western coastal states, most flooding occurs in conjunction with extreme precipitation events referred to as “atmospheric rivers” (see Ch. 9: Extreme Storms),72 ,73 with mountain snowpack being vulnerable to these typically warmer-than-normal storms and their potential for rain on existing snow cover.74 Hurricanes and tropical storms are an important driver of flooding events in the eastern United States. Changes in streamflow rates depend on many factors, both human and natural, in addition to climate change. Deforestation, urbanization, dams, floodwater management activities, and changes in agricultural practices can all play a role in past and future changes in flood statistics. Projection of future changes is thus a complex multivariate problem.34
The IPCC AR57 did not attribute changes in flooding to anthropogenic influence nor report detectable changes in flooding magnitude, duration, or frequency. Trends in extreme high values of streamflow are mixed across the United States.34 ,75 ,76 Analysis of 200 U.S. stream gauges indicates areas of both increasing and decreasing flooding magnitude77 but does not provide robust evidence that these trends are attributable to human influences. Significant increases in flood frequency have been detected in about one-third of stream gauge stations examined for the central United States, with a much stronger signal of frequency change than is found for changes in flood magnitude in these gauges.78 This apparent disparity with ubiquitous increases in observed extreme precipitation (Figure 7.2) can be partly explained by the seasonality of the two phenomena. Extreme precipitation events in the eastern half of the CONUS are larger in the summer and fall when soil moisture and seasonal streamflow levels are low and less favorable for flooding.79 By contrast, high streamflow events are often larger in the spring and winter when soil moisture is high and snowmelt and frozen ground can enhance runoff.80 Furthermore, floods may be poorly explained by daily precipitation characteristics alone; the relevant mechanisms are more complex, involving processes that are seasonally and geographically variable, including the seasonal cycles of soil moisture content and snowfall/snowmelt.81
Recent analysis of annual maximum streamflow shows statistically significant trends in the upper Mississippi River valley (increasing) and in the Northwest (decreasing).44 In fact, across the midwestern United States, statistically significant increases in flooding are well documented.78 ,82 ,83 ,84 ,85 ,86 ,87 ,88 These increases in flood risk and severity are not attributed to 20th century changes in agricultural practices87 ,89 but instead are attributed mostly to the observed increases in precipitation shown in Figures 7.1 through 7.4.78 ,84 ,89 ,90 Trends in maximum streamflow in the northeastern United States are less dramatic and less spatially coherent,44 ,80 although one study found mostly increasing trends91 in that region, consistent with the increasing trends in observed extreme precipitation in the region (Ch. 6: Temperature Change).34 ,80
The nature of the proxy archives complicates the reconstruction of past flood events in a gridded fashion as has been done with droughts. However, reconstructions of past river outflows do exist. For instance, it has been suggested that the mid-20th century water allocations from the Colorado River were made during one of the wettest periods of the past five centuries.92 For the eastern United States, the Mississippi River has undergone century-scale variability in flood frequency—perhaps linked to the moisture availability in the central United States and the temperature structure of the Atlantic Ocean.93
The complex mix of processes complicates the formal attribution of observed flooding trends to anthropogenic climate change and suggests that additional scientific rigor is needed in flood attribution studies.94 As noted above, precipitation increases have been found to strongly influence changes in flood statistics. However, in U.S. regions, no formal attribution of precipitation changes to anthropogenic forcing has been made so far, so indirect attribution of flooding changes is not possible. Hence, no formal attribution of observed flooding changes to anthropogenic forcing has been claimed.78
A projection study based on coupling an ensemble of regional climate model output to a hydrology model95 finds that the magnitude of future very extreme runoff (which can lead to flooding) is decreased in most of the summer months in Washington State, Oregon, Idaho, and western Montana but substantially increases in the other seasons. Projected weighted increases in extreme runoff from the coast to the Cascade Mountains are particularly large in that study during the fall and winter which are not evident in the weighted seasonal averaged CMIP5 runoff projections.2 For the West Coast of the United States, extremely heavy precipitation from intense atmospheric river storms is an important factor in flood frequency and severity.55 ,96 Projections indicate greater frequency of heavy atmospheric rivers in the future (e.g., Dettinger et al. 2011;96 Warner et al. 2015;57 Gao et al. 2015;58 see further discussion in Ch. 9: Extreme Storms). Translating these increases in atmospheric river frequency to their impact on flood frequency requires a detailed representation of western states topography in the global projection models and/or via dynamic downscaling to regional models and is a rapidly developing science. In a report prepared for the Federal Insurance and Mitigation Administration of the Federal Emergency Management Agency, a regression-based approach of scaling river gauge data based on seven commonly used climate change indices from the CMIP3 database97 found that at the end of the 21st century the 1% annual chance floodplain area would increase in area by about 30%, with larger changes in the Northeast and Great Lakes regions and smaller changes in the central part of the country and the Gulf Coast.98
Urban flooding results from heavy precipitation events that overwhelm the existing sewer infrastructure’s ability to convey the resulting stormwater. Future increases in daily and sub-daily extreme precipitation rates will require significant upgrades to many communities’ storm sewer systems, as will sea level rise in coastal cities and towns.99 ,100
No studies have formally attributed (see Ch. 3: Detection and Attribution) long-term changes in observed flooding of major rivers in the United States to anthropogenic forcing. We conclude that there is medium confidence that detectable (though not attributable to anthropogenic forcing changes) increases in flood statistics have occurred in parts of the central United States. Key Finding 3 of Chapter 7: Precipitation Change states that the frequency and intensity of heavy precipitation events are projected to continue to increase over the 21st century with high confidence. Given the connection between extreme precipitation and flooding, and the complexities of other relevant factors, we concur with the IPCC Special Report on Extremes (SREX) assessment of “medium confidence (based on physical reasoning) that projected increases in heavy rainfall would contribute to increases in local flooding in some catchments or regions”.101
Existing studies of individual extreme flooding events are confined to changes in the locally responsible precipitation event and have not included detailed analyses of the events’ hydrology. Gochis et al.102 describe the massive floods of 2013 along the Colorado front range, estimating that the streamflow amounts ranged from 50- to 500-year return values across the region. Hoerling et al.17 analyzed the 2013 northeastern Colorado heavy multiday precipitation event and resulting flood, finding little evidence of an anthropogenic influence on its occurrence. However, Pall et al.103 challenge their event attribution methodology with a more constrained study and find that the thermodynamic response of precipitation in this event due to anthropogenic forcing was substantially increased. The Pall et al.103 approach does not rule out that the likelihood of the extremely rare large-scale meteorological pattern responsible for the flood may have changed.
8.3: Wildfires
A global phenomenon with natural (lightning) and human-caused ignition sources, wildfire represents a critical ecosystem process. Recent decades have seen a profound increase in forest fire activity over the western United States and Alaska.104 ,105 ,106 ,107 The frequency of large wildfires is influenced by a complex combination of natural and human factors. Temperature, soil moisture, relative humidity, wind speed, and vegetation (fuel density) are important aspects of the relationship between fire frequency and ecosystems. Forest management and fire suppression practices can also alter this relationship from what it was in the preindustrial era. Changes in these control parameters can interact with each other in complex ways with the potential for tipping points—in both fire frequency and in ecosystem properties—that may be crossed as the climate warms.
Figure 8.3 shows that the number of large fires has increased over the period 1984–2011, with high statistical significance in 7 out of 10 western U.S. regions across a large variety of vegetation, elevation, and climatic types.108 State-level fire data over the 20th century109 indicates that area burned in the western United States decreased from 1916 to about 1940, was at low levels until the 1970s, then increased into the more recent period. Modeled increases in temperatures and vapor pressure deficits due to anthropogenic climate change have increased forest fire activity in the western United States by increasing the aridity of forest fuels during the fire season.104 Increases in these relevant climatic drivers were found to be responsible for over half the observed increase in western U.S. forest fuel aridity from 1979 to 2015 and doubled the forest fire area over the period 1984–2015.104 Littell et al. (2009, 2010, 2016)109 ,110 ,111 found that two climatic mechanisms affect fire in the western United States: increased fuel flammability driven by warmer, drier conditions and increased fuel availability driven by antecedent moisture. Littell et al.111 found a clear link between increased drought and increased fire risk. Yoon et al.112 assessed the 2014 fire season, finding an increased risk of fire in California. While fire suppression practices can also lead to a significant increase in fire risk in lower-elevation and drier forest types, this is less important in higher-elevation and moister forests.113 ,114 ,115 Increases in future forest fire extent, frequency, and intensity depend strongly on local ecosystem properties and will vary greatly across the United States. Westerling et al.116 projected substantial increases in forest fire frequency in the Greater Yellowstone ecosystem by mid-century under the older SRES A2 emissions scenario, and further stated that years without large fires in the region will become extremely rare. Stavros et al.117 projected increases in very large fires (greater than 50,000 acres) across the western United States by mid-century under both the lower and higher scenarios (RCP4.5 and RCP8.5, respectively). Likewise, Prestemon et al.118 projected significant increases in lightning-ignited wildfire in the Southeast by mid-century but with substantial differences between ecoregions. However, other factors, related to climate change such as water scarcity or insect infestations may act to stifle future forest fire activity by reducing growth or otherwise killing trees leading to fuel reduction.110
Figure 8.3
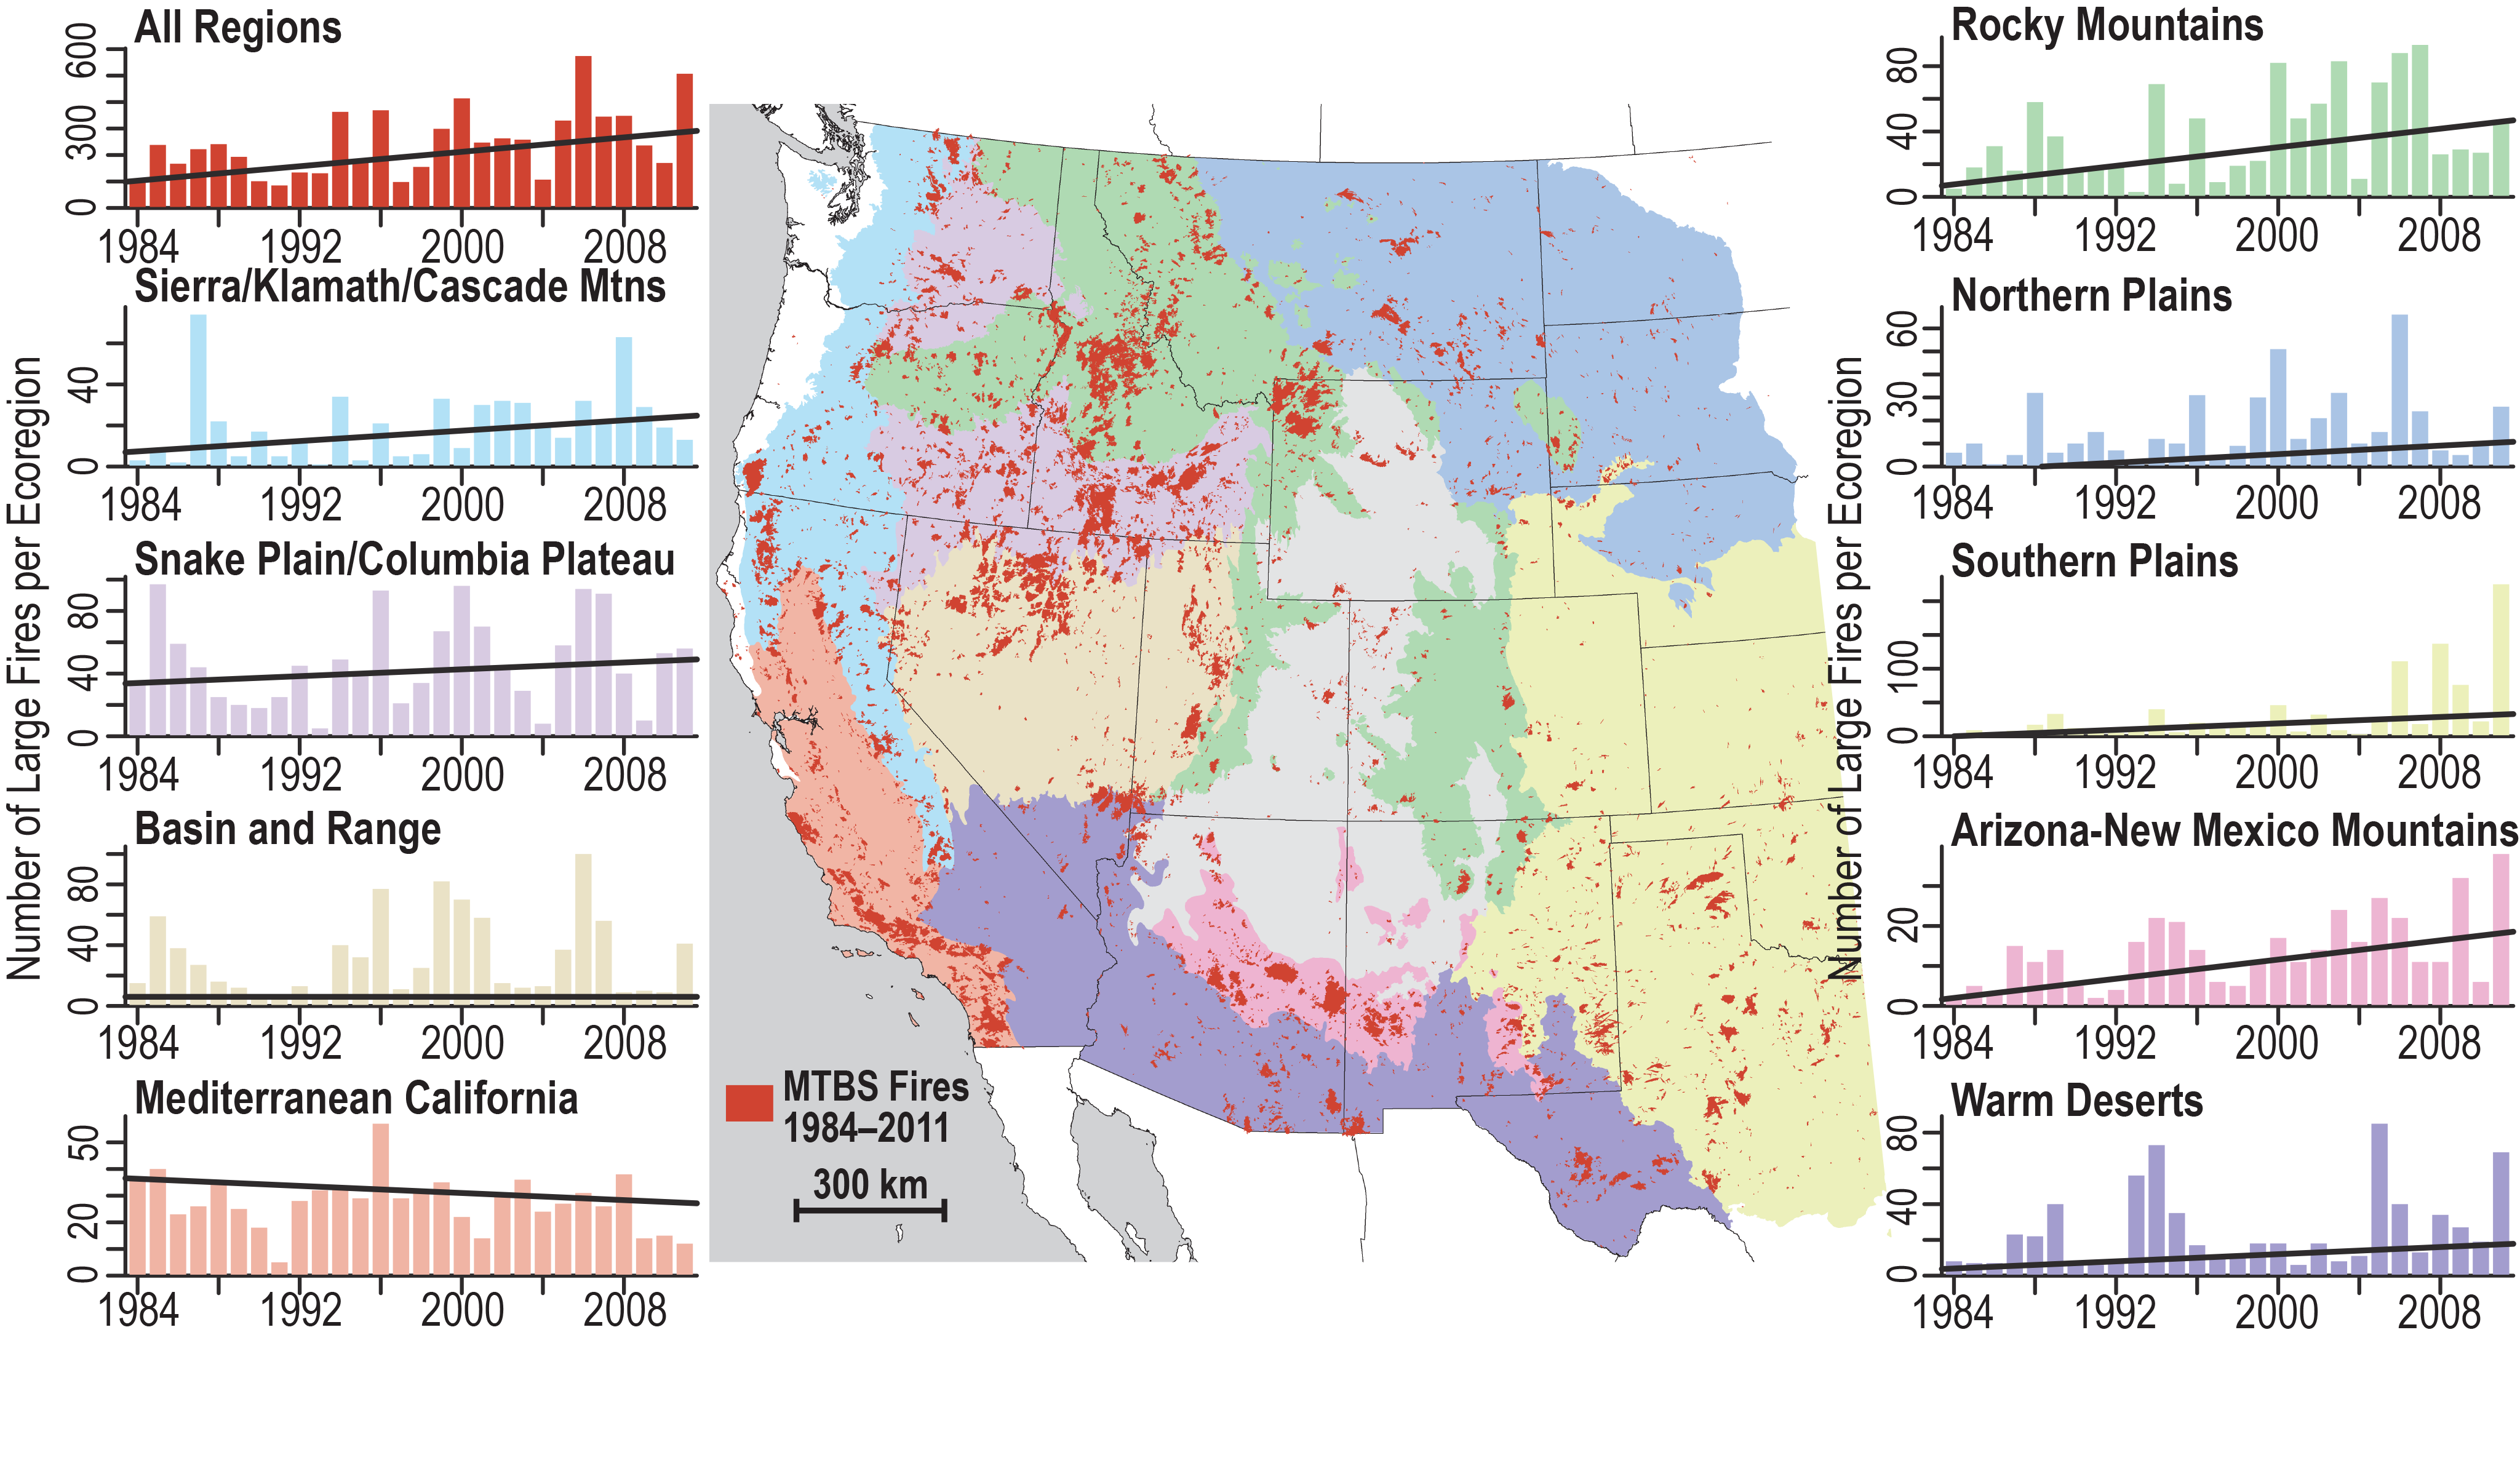
Trends in the annual number of large fires in the western United States for a variety of ecoregions. The black lines are fitted trend lines. Statistically significant at a 10% level for all regions except the Snake Plain/Columbian Plateau, Basin and Range, and Mediterranean California regions. (Figure source: Dennison et al.108 ).
Historically, wildfires have been less frequent and of smaller extent in Alaska compared to the rest of the globe.119 ,120 Shortened land snow cover seasons and higher temperatures have made the Arctic more vulnerable to wildfire.119 ,120 ,121 Total area burned and the number of large fires (those with area greater than 1,000 square km or 386 square miles) in Alaska exhibits significant interannual and decadal scale variability from influences of atmospheric circulation patterns and controlled burns, but have likely increased since 1959.122 The most recent decade has seen an unusually large number of severe wildfire years in Alaska, for which the risk of severe fires has likely increased by 33%–50% as a result of anthropogenic climate change123 and is projected to increase by up to a factor of four by the end of the century under the mid-high scenario (RCP6.0).121 Historically less flammable tundra and cooler boreal forest regions could shift into historically unprecedented fire risk regimes as a consequence of temperatures increasing above the minimum thresholds required for burning. Alaska’s fire season is also likely lengthening—a trend expected to continue.119 ,124 Thresholds in temperature and precipitation shape Arctic fire regimes, and projected increases in future lightning activity imply increased vulnerability to future climate change.119 ,121 Alaskan tundra and forest wildfires will likely increase under warmer and drier conditions124 ,125 and potentially result in a transition into a fire regime unprecedented in the last 10,000 years.126 Total area burned is projected to increase between 25% and 53% by the end of the century.127
Boreal forests and tundra contain large stores of carbon, approximately 50% of the total global soil carbon.128 Increased fire activity could deplete these stores, releasing them to the atmosphere to serve as an additional source of atmospheric CO2 and alter the carbon cycle if ecosystems change from higher to lower carbon densities.126 ,128 Additionally, increased fires in Alaska may also enhance the degradation of Alaska’s permafrost, blackening the ground, reducing surface albedo, and removing protective vegetation.
Both anthropogenic climate change and the legacy of land use/management have an influence on U.S. wildfires and are subtly and inextricably intertwined. Forest management practices have resulted in higher fuel densities in most U.S. forests, except in the Alaskan bush and the higher mountainous regions of the western United States. Nonetheless, there is medium confidence for a human-caused climate change contribution to increased forest fire activity in Alaska in recent decades with a likely further increase as the climate continues to warm, and low to medium confidence for a detectable human climate change contribution in the western United States based on existing studies. Recent literature does not contain a complete robust detection and attribution analysis of forest fires including estimates of natural decadal and multidecadal variability, as described in Chapter 3: Detection and Attribution, nor separate the contributions to observed trends from climate change and forest management. These assessment statements about attribution to human-induced climate change are instead multistep attribution statements (Ch. 3: Detection and Attribution) based on plausible model-based estimates of anthropogenic contributions to observed trends. The modeled contributions, in turn, are based on climate variables that are closely linked to fire risk and that, in most cases, have a detectable human influence, such as surface air temperature and snow melt timing.
References
- AECOM, 2013: The Impact of Climate Change and Population Growth on the National Flood Insurance Program Through 2100. 257 pp. URL ↩
- Abatzoglou, J. T., and A. P. Williams, 2016: Impact of anthropogenic climate change on wildfire across western US forests. Proceedings of the National Academy of Sciences, 113, 11770–11775, doi:10.1073/pnas.1607171113. ↩
- Andreadis, K. M., and D. P. Lettenmaier, 2006: Trends in 20th century drought over the continental United States. Geophysical Research Letters, 33, L10403, doi:10.1029/2006GL025711. ↩
- Angélil, O., D. Stone, M. Wehner, C. J. Paciorek, H. Krishnan, and W. Collins, 2017: An independent assessment of anthropogenic attribution statements for recent extreme temperature and rainfall events. Journal of Climate, 30, 5–16, doi:10.1175/JCLI-D-16-0077.1. ↩
- Archfield, S. A., R. M. Hirsch, A. Viglione, and G. Blöschl, 2016: Fragmented patterns of flood change across the United States. Geophysical Research Letters, 43, 10,232–10,239, doi:10.1002/2016GL070590. ↩
- Armstrong, W. H., M. J. Collins, and N. P. Snyder, 2014: Hydroclimatic flood trends in the northeastern United States and linkages with large-scale atmospheric circulation patterns. Hydrological Sciences Journal, 59, 1636–1655, doi:10.1080/02626667.2013.862339. ↩
- Barnett, T. P., D. W. Pierce, H. G. Hidalgo, C. Bonfils, B. D. Santer, T. Das, G. Bala, A. W. Wood, T. Nozawa, A. A. Mirin, D. R. Cayan, and M. D. Dettinger, 2008: Human-induced changes in the hydrology of the western United States. Science, 319, 1080–1083, doi:10.1126/science.1152538. ↩
- Barnett, T. P., and D. W. Pierce, 2009: Sustainable water deliveries from the Colorado River in a changing climate. Proceedings of the National Academy of Sciences, 106, 7334–7338, doi:10.1073/pnas.0812762106. ↩
- Bennet, H. H., F. H. Fowler, F. C. Harrington, R. C. Moore, J. C. Page, M. L. Cooke, H. A. Wallace, and R. G. Tugwell, 1936: Box 13. URL ↩
- Berg, A., J. Sheffield, and P. C. D. Milly, 2017: Divergent surface and total soil moisture projections under global warming. Geophysical Research Letters, 44, 236–244, doi:10.1002/2016GL071921. ↩
- Berghuijs, W. R., R. A. Woods, C. J. Hutton, and M. Sivapalan, 2016: Dominant flood generating mechanisms across the United States. Geophysical Research Letters, 43, 4382–4390, doi:10.1002/2016GL068070. ↩
- Bindoff, N. L., P. A. Stott, K. M. AchutaRao, M. R. Allen, N. Gillett, D. Gutzler, K. Hansingo, G. Hegerl, Y. Hu, S. Jain, I. I. Mokhov, J. Overland, J. Perlwitz, R. Sebbari, and X. Zhang, 2013: Detection and attribution of climate change: From global to regional. T.F. Stocker, D. Qin, G.-K. Plattner, M. Tignor, S.K. Allen, J. Boschung, A. Nauels, Y. Xia, V. Bex, and P.M. Midgley, Eds., Cambridge University Press, 867–952. URL ↩
- Bond, N. A., M. F. Cronin, H. Freeland, and N. Mantua, 2015: Causes and impacts of the 2014 warm anomaly in the NE Pacific. Geophysical Research Letters, 42, 3414–3420, doi:10.1002/2015GL063306. ↩
- Bonfils, C., B. D. Santer, D. W. Pierce, H. G. Hidalgo, G. Bala, T. Das, T. P. Barnett, D. R. Cayan, C. Doutriaux, A. W. Wood, A. Mirin, and T. Nozawa, 2008: Detection and attribution of temperature changes in the mountainous western United States. Journal of Climate, 21, 6404–6424, doi:10.1175/2008JCLI2397.1. ↩
- Brown, P. M., E. K. Heyerdahl, S. G. Kitchen, and M. H. Weber, 2008: Climate effects on historical fires (1630–1900) in Utah. International Journal of Wildland Fire, 17, 28–39, doi:10.1071/WF07023. ↩
- Cayan, D. R., T. Das, D. W. Pierce, T. P. Barnett, M. Tyree, and A. Gershunov, 2010: Future dryness in the southwest US and the hydrology of the early 21st century drought. Proceedings of the National Academy of Sciences, 107, 21271–21276, doi:10.1073/pnas.0912391107. ↩
- Cayan, D., K. Kunkel, C. Castro, A. Gershunov, J. Barsugli, A. Ray, J. Overpeck, M. Anderson, J. Russell, B. Rajagopalan, I. Rangwala, and P. Duffy, 2013: Ch. 6: Future climate: Projected average. G. Garfin, A. Jardine, R. Merideth, M. Black, and S. LeRoy, Eds., Island Press, 153–196. URL ↩
- Cheng, L., M. Hoerling, A. AghaKouchak, B. Livneh, X.-W. Quan, and J. Eischeid, 2016: How has human-induced climate change affected California drought risk? Journal of Climate, 29, 111–120, doi:10.1175/JCLI-D-15-0260.1. ↩
- Christensen, N., and D. P. Lettenmaier, 2007: A multimodel ensemble approach to assessment of climate change impacts on the hydrology and water resources of the Colorado River Basin. Hydrology and Earth System Sciences, 11, 1417–1434, doi:10.5194/hess-11-1417-2007. ↩
- Coats, S., B. I. Cook, J. E. Smerdon, and R. Seager, 2015: North American pancontinental droughts in model simulations of the last millennium. Journal of Climate, 28, 2025–2043, doi:10.1175/JCLI-D-14-00634.1. ↩
- Collins, M., R. Knutti, J. Arblaster, J.-L. Dufresne, T. Fichefet, P. Friedlingstein, X. Gao, W. J. Gutowski, T. Johns, G. Krinner, M. Shongwe, C. Tebaldi, A. J. Weaver, and M. Wehner, 2013: Long-term climate change: Projections, commitments and irreversibility. T.F. Stocker, D. Qin, G.-K. Plattner, M. Tignor, S.K. Allen, J. Boschung, A. Nauels, Y. Xia, V. Bex, and P.M. Midgley, Eds., Cambridge University Press, 1029–1136. URL ↩
- Cook, B. I., T. R. Ault, and J. E. Smerdon, 2015: Unprecedented 21st century drought risk in the American Southwest and Central Plains. Science Advances, 1, e1400082, doi:10.1126/sciadv.1400082. ↩
- Cook, E. R., C. A. Woodhouse, C. M. Eakin, D. M. Meko, and D. W. Stahle, 2004: Long-term aridity changes in the western United States. Science, 306, 1015–1018, doi:10.1126/science.1102586. ↩
- Dai, A., 2013: Increasing drought under global warming in observations and models. Nature Climate Change, 3, 52–58, doi:10.1038/nclimate1633. ↩
- Das, T., D. W. Pierce, D. R. Cayan, J. A. Vano, and D. P. Lettenmaier, 2011: The importance of warm season warming to western U.S. streamflow changes. Geophysical Research Letters, 38, L23403, doi:10.1029/2011GL049660. ↩
- Dennison, P. E., S. C. Brewer, J. D. Arnold, and M. A. Moritz, 2014: Large wildfire trends in the western United States, 1984–2011. Geophysical Research Letters, 41, 2928–2933, doi:10.1002/2014GL059576. ↩
- Dettinger, M. D., 2013: Atmospheric rivers as drought busters on the U.S. West Coast. Journal of Hydrometeorology, 14, 1721–1732, doi:10.1175/JHM-D-13-02.1. ↩
- Dettinger, M. D., F. M. Ralph, T. Das, P. J. Neiman, and D. R. Cayan, 2011: Atmospheric rivers, floods and the water resources of California. Water, 3, 445–478, doi:10.3390/w3020445. ↩
- Dettinger, M., 2011: Climate change, atmospheric rivers, and floods in California–a multimodel analysis of storm frequency and magnitude changes. Journal of the American Water Resources Association, 47, 514–523, doi:10.1111/j.1752-1688.2011.00546.x. ↩
- Diffenbaugh, N. S., D. L. Swain, and D. Touma, 2015: Anthropogenic warming has increased drought risk in California. Proceedings of the National Academy of Sciences, 112, 3931–3936, doi:10.1073/pnas.1422385112. ↩
- Diffenbaugh, N. S., and M. Scherer, 2013: Likelihood of July 2012 U.S. temperatures in pre-industrial and current forcing regimes [in “Explaining Extreme Events of 2013 from a Climate Perspective”]. Bulletin of the American Meteorological Society, 94 (9), S6–S9, doi:10.1175/BAMS-D-13-00085.1. ↩
- EPA, 2016: Climate Change Indicators in the United States, 2016. 4th edition. 96 pp., U.S. Environmental Protection Agency. URL ↩
- Flannigan, M., B. Stocks, M. Turetsky, and M. Wotton, 2009: Impacts of climate change on fire activity and fire management in the circumboreal forest. Global Change Biology, 15, 549–560, doi:10.1111/j.1365-2486.2008.01660.x. ↩
- Frans, C., E. Istanbulluoglu, V. Mishra, F. Munoz-Arriola, and D. P. Lettenmaier, 2013: Are climatic or land cover changes the dominant cause of runoff trends in the Upper Mississippi River Basin? Geophysical Research Letters, 40, 1104–1110, doi:10.1002/grl.50262. ↩
- Frei, A., K. E. Kunkel, and A. Matonse, 2015: The seasonal nature of extreme hydrological events in the northeastern United States. Journal of Hydrometeorology, 16, 2065–2085, doi:10.1175/JHM-D-14-0237.1. ↩
- French, N. H. F., L. K. Jenkins, T. V. Loboda, M. Flannigan, R. Jandt, L. L. Bourgeau-Chavez, and M. Whitley, 2015: Fire in arctic tundra of Alaska: Past fire activity, future fire potential, and significance for land management and ecology. International Journal of Wildland Fire, 24, 1045–1061, doi:10.1071/WF14167. ↩
- Funk, C., A. Hoell, and D. Stone, 2014: Examining the contribution of the observed global warming trend to the California droughts of 2012/13 and 2013/14 [in “Explaining Extreme Events of 2013 from a Climate Perspective”]. Bulletin of the American Meteorological Society, 95 (9), S11–S15, doi:10.1175/1520-0477-95.9.S1.1. ↩
- Fyfe, J. C., C. Derksen, L. Mudryk, G. M. Flato, B. D. Santer, N. C. Swart, N. P. Molotch, X. Zhang, H. Wan, V. K. Arora, J. Scinocca, and Y. Jiao, 2017: Large near-term projected snowpack loss over the western United States. Nature Communications, 8, 14996, doi:10.1038/ncomms14996. ↩
- Gao, Y., J. Lu, L. R. Leung, Q. Yang, S. Hagos, and Y. Qian, 2015: Dynamical and thermodynamical modulations on future changes of landfalling atmospheric rivers over western North America. Geophysical Research Letters, 42, 7179–7186, doi:10.1002/2015GL065435. ↩
- Gochis, D. et al., 2015: The Great Colorado Flood of September 2013. Bulletin of the American Meteorological Society, 96 (12), 1461–1487, doi:10.1175/BAMS-D-13-00241.1. ↩
- Groisman, P. Y., R. W. Knight, and T. R. Karl, 2001: Heavy precipitation and high streamflow in the contiguous United States: Trends in the twentieth century. Bulletin of the American Meteorological Society, 82, 219–246, doi:10.1175/1520-0477(2001)082<0219:hpahsi>2.3.co;2. ↩
- Guan, B., D. E. Waliser, F. M. Ralph, E. J. Fetzer, and P. J. Neiman, 2016: Hydrometeorological characteristics of rain-on-snow events associated with atmospheric rivers. Geophysical Research Letters, 43, 2964–2973, doi:10.1002/2016GL067978. ↩
- Guan, B., N. P. Molotch, D. E. Waliser, E. J. Fetzer, and P. J. Neiman, 2013: The 2010/2011 snow season in California’s Sierra Nevada: Role of atmospheric rivers and modes of large-scale variability. Water Resources Research, 49, 6731–6743, doi:10.1002/wrcr.20537. ↩
- Hartmann, D. L., 2015: Pacific sea surface temperature and the winter of 2014. Geophysical Research Letters, 42, 1894–1902, doi:10.1002/2015GL063083. ↩
- Harvey, B. J., 2016: Human-caused climate change is now a key driver of forest fire activity in the western United States. Proceedings of the National Academy of Sciences, 113, 11649–11650, doi:10.1073/pnas.1612926113. ↩
- Hegerl, G. C., F. W. Zwiers, P. Braconnot, N. P. Gillett, Y. Luo, J. A. M. Orsini, N. Nicholls, J. E. Penner, and P. A. Stott, 2007: Understanding and attributing climate change. S. Solomon, D. Qin, M. Manning, Z. Chen, M. Marquis, K.B. Averyt, M. Tignor, and H.L. Miller, Eds., Cambridge University Press, 663–745. URL ↩
- Hidalgo, H. G., T. Das, M. D. Dettinger, D. R. Cayan, D. W. Pierce, T. P. Barnett, G. Bala, A. Mirin, A. W. Wood, C. Bonfils, B. D. Santer, and T. Nozawa, 2009: Detection and attribution of streamflow timing changes to climate change in the western United States. Journal of Climate, 22, 3838–3855, doi:10.1175/2009jcli2470.1. ↩
- Higuera, P. E., J. T. Abatzoglou, J. S. Littell, and P. Morgan, 2015: The changing strength and nature of fire-climate relationships in the northern Rocky Mountains, U.S.A., 1902-2008. PLoS ONE, 10, e0127563, doi:10.1371/journal.pone.0127563. ↩
- Hirsch, R. M., and K. R. Ryberg, 2012: Has the magnitude of floods across the USA changed with global CO2 levels? Hydrological Sciences Journal, 57, 1–9, doi:10.1080/02626667.2011.621895. ↩
- Hoerling, M., D. Lettenmaier, D. Cayan, and B. Udall, 2009: Reconciling future Colorado River flows. Southwest Hydrology, 8, 20–21.31. URL ↩
- Hoerling, M., J. Eischeid, A. Kumar, R. Leung, A. Mariotti, K. Mo, S. Schubert, and R. Seager, 2014: Causes and predictability of the 2012 Great Plains drought. Bulletin of the American Meteorological Society, 95, 269–282, doi:10.1175/BAMS-D-13-00055.1. ↩
- Hoerling, M., M. Chen, R. Dole, J. Eischeid, A. Kumar, J. W. Nielsen-Gammon, P. Pegion, J. Perlwitz, X.-W. Quan, and T. Zhang, 2013: Anatomy of an extreme event. Journal of Climate, 26, 2811–2832, doi:10.1175/JCLI-D-12-00270.1. ↩
- Hu, F. S., P. E. Higuera, P. Duffy, M. L. Chipman, A. V. Rocha, A. M. Young, R. Kelly, and M. C. Dietze, 2015: Arctic tundra fires: Natural variability and responses to climate change. Frontiers in Ecology and the Environment, 13, 369–377, doi:10.1890/150063. ↩
- IPCC, 2012: Summary for policymakers. C.B. Field, V. Barros, T.F. Stocker, D. Qin, D.J. Dokken, K.L. Ebi, M.D. Mastrandrea, K.J. Mach, G.-K. Plattner, S.K. Allen, M. Tignor, and P.M. Midgley, Eds., Cambridge University Press, 3–21. URL ↩
- Joly, K., P. A. Duffy, and T. S. Rupp, 2012: Simulating the effects of climate change on fire regimes in Arctic biomes: Implications for caribou and moose habitat. Ecosphere, 3, 1–18, doi:10.1890/ES12-00012.1. ↩
- Kapnick, S. B., and T. L. Delworth, 2013: Controls of global snow under a changed climate. Journal of Climate, 26, 5537–5562, doi:10.1175/JCLI-D-12-00528.1. ↩
- Karl, T. R., J. T. Melillo, and T. C. Peterson, eds., 2009: Global Climate Change Impacts in the United States. Cambridge University Press, 189 pp. URL ↩
- Kasischke, E. S., and M. R. Turetsky, 2006: Recent changes in the fire regime across the North American boreal region—Spatial and temporal patterns of burning across Canada and Alaska. Geophysical Research Letters, 33, L09703, doi:10.1029/2006GL025677. ↩
- Kelly, R., M. L. Chipman, P. E. Higuera, I. Stefanova, L. B. Brubaker, and F. S. Hu, 2013: Recent burning of boreal forests exceeds fire regime limits of the past 10,000 years. Proceedings of the National Academy of Sciences, 110, 13055–13060, doi:10.1073/pnas.1305069110. ↩
- Klos, P. Z., T. E. Link, and J. T. Abatzoglou, 2014: Extent of the rain–snow transition zone in the western U.S. under historic and projected climate. Geophysical Research Letters, 41, 4560–4568, doi:10.1002/2014GL060500. ↩
- Knowles, N., M. D. Dettinger, and D. R. Cayan, 2006: Trends in snowfall versus rainfall in the western United States. Journal of Climate, 19, 4545–4559, doi:10.1175/JCLI3850.1. ↩
- Knutson, T. R., F. Zeng, and A. T. Wittenberg, 2014: Seasonal and annual mean precipitation extremes occurring during 2013: A U.S. focused analysis [in “Explaining Extreme Events of 2013 from a Climate Perspective”]. Bulletin of the American Meteorological Society, 95 (9), S19–S23, doi:10.1175/1520-0477-95.9.S1.1. ↩
- Kormos, P. R., C. H. Luce, S. J. Wenger, and W. R. Berghuijs, 2016: Trends and sensitivities of low streamflow extremes to discharge timing and magnitude in Pacific Northwest mountain streams. Water Resources Research, 52, 4990–5007, doi:10.1002/2015WR018125. ↩
- Lee, M.-Y., C.-C. Hong, and H.-H. Hsu, 2015: Compounding effects of warm sea surface temperature and reduced sea ice on the extreme circulation over the extratropical North Pacific and North America during the 2013–2014 boreal winter. Geophysical Research Letters, 42, 1612–1618, doi:10.1002/2014GL062956. ↩
- Littell, J. S., D. L. Peterson, K. L. Riley, Y. Liu, and C. H. Luce, 2016: A review of the relationships between drought and forest fire in the United States. Global Change Biology, 22, 2353–2369, doi:10.1111/gcb.13275. ↩
- Littell, J. S., D. McKenzie, D. L. Peterson, and A. L. Westerling, 2009: Climate and wildfire area burned in western U.S. ecoprovinces, 1916-2003. Ecological Applications, 19, 1003–1021, doi:10.1890/07-1183.1. ↩
- Littell, J. S., E. E. Oneil, D. McKenzie, J. A. Hicke, J. A. Lutz, R. A. Norheim, and M. M. Elsner, 2010: Forest ecosystems, disturbance, and climatic change in Washington State, USA. Climatic Change, 102, 129–158, doi:10.1007/s10584-010-9858-x. ↩
- Livneh, B., and M. P. Hoerling, 2016: The physics of drought in the U.S. Central Great Plains. Journal of Climate, 29, 6783–6804, doi:10.1175/JCLI-D-15-0697.1. ↩
- Luce, C. H., J. T. Abatzoglou, and Z. A. Holden, 2013: The missing mountain water: Slower westerlies decrease orographic enhancement in the Pacific Northwest USA. Science, 342, 1360–1364, doi:10.1126/science.1242335. ↩
- Luce, C. H., V. Lopez-Burgos, and Z. Holden, 2014: Sensitivity of snowpack storage to precipitation and temperature using spatial and temporal analog models. Water Resources Research, 50, 9447–9462, doi:10.1002/2013WR014844. ↩
- Luce, C. H., and Z. A. Holden, 2009: Declining annual streamflow distributions in the Pacific Northwest United States, 1948–2006. Geophysical Research Letters, 36, doi:10.1029/2009GL039407. ↩
- Mallakpour, I., and G. Villarini, 2015: The changing nature of flooding across the central United States. Nature Climate Change, 5, 250–254, doi:10.1038/nclimate2516. ↩
- Mallakpour, I., and G. Villarini, 2016: Investigating the relationship between the frequency of flooding over the central United States and large-scale climate. Advances in Water Resources, 92, 159–171, doi:10.1016/j.advwatres.2016.04.008. ↩
- Mao, Y., B. Nijssen, and D. P. Lettenmaier, 2015: Is climate change implicated in the 2013–2014 California drought? A hydrologic perspective. Geophysical Research Letters, 42, 2805–2813, doi:10.1002/2015GL063456. ↩
- Masson-Delmotte, V., M. Schulz, A. Abe-Ouchi, J. Beer, A. Ganopolski, J. F. González Rouco, E. Jansen, K. Lambeck, J. Luterbacher, T. Naish, T. Osborn, B. Otto-Bliesner, T. Quinn, R. Ramesh, M. Rojas, X. Shao, and A. Timmermann, 2013: Information from paleoclimate archives. T.F. Stocker, D. Qin, G.-K. Plattner, M. Tignor, S.K. Allen, J. Boschung, A. Nauels, Y. Xia, V. Bex, and P.M. Midgley, Eds., Cambridge University Press, 383–464. URL ↩
- McCabe, G. J., and D. M. Wolock, 2014: Spatial and temporal patterns in conterminous United States streamflow characteristics. Geophysical Research Letters, 41, 6889–6897, doi:10.1002/2014GL061980. ↩
- McGuire, A. D., L. G. Anderson, T. R. Christensen, S. Dallimore, L. Guo, D. J. Hayes, M. Heimann, T. D. Lorenson, R. W. MacDonald, and N. Roulet, 2009: Sensitivity of the carbon cycle in the Arctic to climate change. Ecological Monographs, 79, 523–555, doi:10.1890/08-2025.1. ↩
- Merz, B., S. Vorogushyn, S. Uhlemann, J. Delgado, and Y. Hundecha, 2012: HESS Opinions “More efforts and scientific rigour are needed to attribute trends in flood time series.” Hydrology and Earth System Sciences, 16, 1379–1387, doi:10.5194/hess-16-1379-2012. ↩
- Milly, P. C. D., and K. A. Dunne, 2016: Potential evapotranspiration and continental drying. Nature Climate Change, 6, 946–969, doi:10.1038/nclimate3046. ↩
- Mo, K. C., and D. P. Lettenmaier, 2015: Heat wave flash droughts in decline. Geophysical Research Letters, 42, 2823–2829, doi:10.1002/2015GL064018. ↩
- Mo, K. C., and D. P. Lettenmaier, 2016: Precipitation deficit flash droughts over the United States. Journal of Hydrometeorology, 17, 1169–1184, doi:10.1175/jhm-d-15-0158.1. ↩
- Mote, P. W., 2003: Trends in snow water equivalent in the Pacific Northwest and their climatic causes. Geophysical Research Letters, 30, 1601, doi:10.1029/2003GL017258. ↩
- Mote, P. W., A. F. Hamlet, M. P. Clark, and D. P. Lettenmaier, 2005: Declining mountain snowpack in western North America. Bulletin of the American Meteorological Society, 86, 39–49, doi:10.1175/BAMS-86-1-39. ↩
- Mote, P. W., D. E. Rupp, S. Li, D. J. Sharp, F. Otto, P. F. Uhe, M. Xiao, D. P. Lettenmaier, H. Cullen, and M. R. Allen, 2016: Perspectives on the causes of exceptionally low 2015 snowpack in the western United States. Geophysical Research Letters, 43, 10,980–10,988, doi:10.1002/2016GL069965. ↩
- Munoz, S. E., K. E. Gruley, A. Massie, D. A. Fike, S. Schroeder, and J. W. Williams, 2015: Cahokia’s emergence and decline coincided with shifts of flood frequency on the Mississippi River. Proceedings of the National Academy of Sciences, 112, 6319–6324, doi:10.1073/pnas.1501904112. ↩
- NOAA, 2008: Drought: Public Fact Sheet. National Oceanic and Atmospheric Administration, National Weather Service. URL ↩
- Najafi, M. R., and H. Moradkhani, 2015: Multi-model ensemble analysis of runoff extremes for climate change impact assessments. Journal of Hydrology, 525, 352–361, doi:10.1016/j.jhydrol.2015.03.045. ↩
- Neiman, P. J., L. J. Schick, F. M. Ralph, M. Hughes, and G. A. Wick, 2011: Flooding in western Washington: The connection to atmospheric rivers. Journal of Hydrometeorology, 12, 1337–1358, doi:10.1175/2011JHM1358.1. ↩
- Novotny, E. V., and H. G. Stefan, 2007: Stream flow in Minnesota: Indicator of climate change. Journal of Hydrology, 334, 319–333, doi:10.1016/j.jhydrol.2006.10.011. ↩
- O’Gorman, P. A., 2014: Contrasting responses of mean and extreme snowfall to climate change. Nature, 512, 416–418, doi:10.1038/nature13625. ↩
- Pall, P. C. M. P., M. F. Wehner, D. A. Stone, C. J. Paciorek, and W. D. Collins, 2017: Diagnosing anthropogenic contributions to heavy Colorado rainfall in September 2013. Weather and Climate Extremes, 17, 1–6, doi:10.1016/j.wace.2017.03.004. ↩
- Partain, J. L., Jr., S. Alden, U. S. Bhatt, P. A. Bieniek, B. R. Brettschneider, R. Lader, P. Q. Olsson, T. S. Rupp, H. Strader, R. L. T. Jr., J. E. Walsh, A. D. York, and R. H. Zieh, 2016: An assessment of the role of anthropogenic climate change in the Alaska fire season of 2015 [in “Explaining Extreme Events of 2015 from a Climate Perspective”]. Bulletin of the American Meteorological Society, 97 (12), S14–S18, doi:10.1175/BAMS-D-16-0149.1. ↩
- Pierce, D. W., T. P. Barnett, H. G. Hidalgo, T. Das, C. Bonfils, B. D. Santer, G. Bala, M. D. Dettinger, D. R. Cayan, A. Mirin, A. W. Wood, and T. Nozawa, 2008: Attribution of declining western US snowpack to human effects. Journal of Climate, 21, 6425–6444, doi:10.1175/2008JCLI2405.1. ↩
- Pierce, D. W., and D. R. Cayan, 2013: The uneven response of different snow measures to human-induced climate warming. Journal of Climate, 26, 4148–4167, doi:10.1175/jcli-d-12-00534.1. ↩
- Prestemon, J. P., U. Shankar, A. Xiu, K. Talgo, D. Yang, E. Dixon, D. McKenzie, and K. L. Abt, 2016: Projecting wildfire area burned in the south-eastern United States, 2011–60. International Journal of Wildland Fire, 25, 715–729, doi:10.1071/WF15124. ↩
- Ralph, F. M., and M. D. Dettinger, 2011: Storms, floods, and the science of atmospheric rivers. Eos, Transactions, American Geophysical Union, 92, 265–266, doi:10.1029/2011EO320001. ↩
- Rhoades, A. M., P. A. Ullrich, and C. M. Zarzycki, 2017: Projecting 21st century snowpack trends in western USA mountains using variable-resolution CESM. Climate Dynamics, Online First, 1–28, doi:10.1007/s00382-017-3606-0. ↩
- Running, S. W., 2006: Is global warming causing more, larger wildfires? Science, 313, 927–928, doi:10.1126/science.1130370. ↩
- Rupp, D. E., P. W. Mote, N. Massey, C. J. Rye, R. Jones, and M. R. Allen, 2012: Did human influence on climate make the 2011 Texas drought more probable? [in “Explaining Extreme Events of 2011 from a Climate Perspective”]. Bulletin of the American Meteorological Society, 93, 1052–1054, doi:10.1175/BAMS-D-12-00021.1. ↩
- Rupp, D. E., P. W. Mote, N. Massey, F. E. L. Otto, and M. R. Allen, 2013: Human influence on the probability of low precipitation in the central United States in 2012 [in “Explaining Extreme Events of 2013 from a Climate Perspective”]. Bulletin of the American Meteorological Society, 94 (9), S2–S6, doi:10.1175/BAMS-D-13-00085.1. ↩
- Ryberg, K. R., W. Lin, and A. V. Vecchia, 2014: Impact of climate variability on runoff in the north-central United States. Journal of Hydrologic Engineering, 19, 148–158, doi:10.1061/(ASCE)HE.1943-5584.0000775. ↩
- SFPUC, 2016: Flood Resilience: Report, Task Order 57 (Draft: May 2016). 302 pp., San Francisco Public Utilities Commission. URL ↩
- Sanford, T., R. Wang, and A. Kenward, 2015: 32. URL ↩
- Schoennagel, T., T. T. Veblen, and W. H. Romme, 2004: The interaction of fire, fuels, and climate across Rocky Mountain forests. BioScience, 54, 661–676, doi:10.1641/0006-3568(2004)054[0661:TIOFFA]2.0.CO;2. ↩
- Seager, R., M. Hoerling, D. S. Siegfried, hailan Wang, B. Lyon, A. Kumar, J. Nakamura, and N. Henderson, 2014: Causes and Predictability of the 2011-14 California Drought. 40 pp., National Oceanic and Atmospheric Administration, Drought Task Force Narrative Team. ↩
- Seager, R., M. Hoerling, S. Schubert, H. Wang, B. Lyon, A. Kumar, J. Nakamura, and N. Henderson, 2015: Causes of the 2011–14 California drought. Journal of Climate, 28, 6997–7024, doi:10.1175/JCLI-D-14-00860.1. ↩
- Sheffield, J., E. F. Wood, and M. L. Roderick, 2012: Little change in global drought over the past 60 years. Nature, 491, 435–438, doi:10.1038/nature11575. ↩
- Slater, L. J., M. B. Singer, and J. W. Kirchner, 2015: Hydrologic versus geomorphic drivers of trends in flood hazard. Geophysical Research Letters, 42, 370–376, doi:10.1002/2014GL062482. ↩
- Stavros, E. N., J. T. Abatzoglou, D. McKenzie, and N. K. Larkin, 2014: Regional projections of the likelihood of very large wildland fires under a changing climate in the contiguous Western United States. Climatic Change, 126, 455–468, doi:10.1007/s10584-014-1229-6. ↩
- Stephens, S. L., J. K. Agee, P. Z. Fulé, M. P. North, W. H. Romme, T. W. Swetnam, and M. G. Turner, 2013: Managing forests and fire in changing climates. Science, 342, 41–42, doi:10.1126/science.1240294. ↩
- Stewart, I. T., D. R. Cayan, and M. D. Dettinger, 2005: Changes toward earlier streamflow timing across western North America. Journal of Climate, 18, 1136–1155, doi:10.1175/JCLI3321.1. ↩
- Swain, D., M. Tsiang, M. Haughen, D. Singh, A. Charland, B. Rajarthan, and N. S. Diffenbaugh, 2014: The extraordinary California drought of 2013/14: Character, context and the role of climate change [in “Explaining Extreme Events of 2013 from a Climate Perspective”]. Bulletin of the American Meteorological Society, 95 (9), S3–S6, doi:10.1175/1520-0477-95.9.S1.1. ↩
- Tebaldi, C., K. Hayhoe, J. M. Arblaster, and G. A. Meehl, 2006: Going to the Extremes: An Intercomparison of Model-Simulated Historical and Future Changes in Extreme Events. Climatic Change, 79, 185–211, doi:10.1007/s10584-006-9051-4. ↩
- Tomer, M. D., and K. E. Schilling, 2009: A simple approach to distinguish land-use and climate-change effects on watershed hydrology. Journal of Hydrology, 376, 24–33, doi:10.1016/j.jhydrol.2009.07.029. ↩
- Trenberth, K. E., A. Dai, G. van der Schrier, P. D. Jones, J. Barichivich, K. R. Briffa, and J. Sheffield, 2014: Global warming and changes in drought. Nature Climate Change, 4, 17–22, doi:10.1038/nclimate2067. ↩
- Villarini, G., and A. Strong, 2014: Roles of climate and agricultural practices in discharge changes in an agricultural watershed in Iowa. Agriculture, Ecosystems & Environment, 188, 204–211, doi:10.1016/j.agee.2014.02.036. ↩
- Walsh, J. et al., 2014: Ch. 2: Our Changing Climate. J.M. Melillo, T. (T. C.. Richmond, and G.W. Yohe, Eds., U.S. Global Change Research Program, 19–67. ↩
- Wang, D., and M. Hejazi, 2011: Quantifying the relative contribution of the climate and direct human impacts on mean annual streamflow in the contiguous United States. Water Resources Research, 47, W00J12, doi:10.1029/2010WR010283. ↩
- Wang, H., and S. Schubert, 2014: Causes of the extreme dry conditions over California during early 2013 [in “Explaining Extreme Events of 2013 from a Climate Perspective”]. Bulletin of the American Meteorological Society, 95 (9), S7–S11, doi:10.1175/1520-0477-95.9.S1.1. ↩
- Warner, M. D., C. F. Mass, and E. P. Salathé Jr., 2015: Changes in winter atmospheric rivers along the North American West Coast in CMIP5 climate models. Journal of Hydrometeorology, 16, 118–128, doi:10.1175/JHM-D-14-0080.1. ↩
- Wehner, M. F., 2013: Very extreme seasonal precipitation in the NARCCAP ensemble: Model performance and projections. Climate Dynamics, 40, 59–80, doi:10.1007/s00382-012-1393-1. ↩
- Wehner, M., D. R. Easterling, J. H. Lawrimore, R. R. Heim Jr, R. S. Vose, and B. D. Santer, 2011: Projections of future drought in the continental United States and Mexico. Journal of Hydrometeorology, 12, 1359–1377, doi:10.1175/2011JHM1351.1. ↩
- Westerling, A. L., H. G. Hidalgo, D. R. Cayan, and T. W. Swetnam, 2006: Warming and earlier spring increase western U.S. forest wildfire activity. Science, 313, 940–943, doi:10.1126/science.1128834. ↩
- Westerling, A. L., M. G. Turner, E. A. H. Smithwick, W. H. Romme, and M. G. Ryan, 2011: Continued warming could transform Greater Yellowstone fire regimes by mid-21st century. Proceedings of the National Academy of Sciences of the United States of America, 108, 13165–13170, doi:10.1073/pnas.1110199108. ↩
- Williams, A. P., R. Seager, J. T. Abatzoglou, B. I. Cook, J. E. Smerdon, and E. R. Cook, 2015: Contribution of anthropogenic warming to California drought during 2012–2014. Geophysical Research Letters, 42, 6819–6828, doi:10.1002/2015GL064924. ↩
- Williams, I. N., and M. S. Torn, 2015: Vegetation controls on surface heat flux partitioning, and land-atmosphere coupling. Geophysical Research Letters, 42, 9416–9424, doi:10.1002/2015GL066305. ↩
- Winters, B. A., J. Angel, C. Ballerine, J. Byard, A. Flegel, D. Gambill, E. Jenkins, S. McConkey, M. Markus, B. A. Bender, and M. J. O’Toole, 2015: Report for the Urban Flooding Awareness Act. 89 pp., Illinois Department of Natural Resources. URL ↩
- Woodhouse, C. A., S. T. Gray, and D. M. Meko, 2006: Updated streamflow reconstructions for the Upper Colorado River Basin. Water Resources Research, 42, doi:10.1029/2005WR004455. ↩
- Yoon, J.-H., B. Kravitz, P. J. Rasch, S.-Y. S. Wang, R. R. Gillies, and L. Hipps, 2015: Extreme fire season in California: A glimpse into the future? Bulletin of the American Meteorological Society, 96 (12), S5–S9, doi:10.1175/bams-d-15-00114.1. ↩
- Young, A. M., P. E. Higuera, P. A. Duffy, and F. S. Hu, 2017: Climatic thresholds shape northern high-latitude fire regimes and imply vulnerability to future climate change. Ecography, 40, 606–617, doi:10.1111/ecog.02205. ↩